 Yesterday I shared my grand plan to thoroughly review my portfolio management again in 2008. My first stop is to drill down to my 2007 results, and understand where the benchmark-beating results come from. Yes, I beat my benchmark index by 1.77%, and that's what is called alpha in portfolio management.
To refresh some memory, earlier in 2007 I set my target asset allocation as follows:
• 50% Domestic Equity
• 35% International Equity
• 15% Cash & Equivalent
Furthermore, I built the following benchmark portfolio to measure my relative performance:
• 50% in Vanguard Total Markets ETF (VTI)
• 35% in iShares MSCI EAFE Index (EFA)
• 15% in Cash (assuming yielding 5% every year)
So conceptually, any deviation from the benchmark performance can only come from two sources:
1) The relative performance in each asset class (i.e. whether my domestic equity holdings are returning more than simply holding VTI for the year.)
2) The difference of actual asset allocation vs. the target allocation (i.e. whether my opportunistic deviation from the target asset allocation has delivered better or worse relative performance.
To understand my relative performance in each asset class, I grouped my investments by the asset class, and tabulated the monthly gains or losses of each asset class separately, and compared them against my benchmark holdings (VTI and EFA). Giving that I use both individual stocks and mutual funds to build my domestic equity holdings, I calculated my gains separately for individual stocks and domestic equity mutual funds -- therefore I can gauge my stock picking and fund picking skills individually.
I have to admit it is a tedious exercise, but skipping all technical details, here is the result:
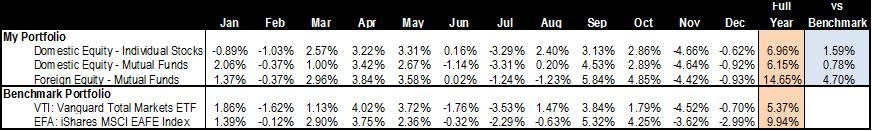
To my surprise, in each bucket of individual (domestic) stocks, domestic equity mutual funds, and foreign equity mutual funds, my portfolio has delivered benchmark-beating results, ranging from beating VTI by about 0.8% in my domestic equity fund choices, to beating EFA by 4.7% in my foreign equity picks.
To translate the relative performance in each asset class to the contribution to the entire portfolio can be done by multiplying that with my average portfolio exposure in each asset class in percentage:
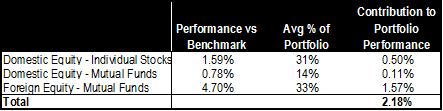
In my December 2007 update of portfolio performance, I claimed that "[f]or the year of 2007, my portfolio recorded a gain of 8.77%, besting my benchmark's 6.98% gain by a good margin." So how should I reconcile the 2.18% in alpha from my calculation above with the 1.79% I claimed in the December flash?
That's where the mix comes to play. I was actually considerably under-weighted in my equity positions -- my cash position averages to 21% throughout the year, dragging the performance in the year where equity return largely outsized the cash.
So conclusion on 2007 portfolio results:
1) Good stock picking and fund picking resulted in outsized performance in every single asset class;
2) Results were partially hurt by conservative deviation from target asset allocation.
In the next episode, we will be discussing the lessons learned in 2007. Stay tuned.


