My Personal Finance Journey

Personal finance observation, musing and decisions in a journey toward financial independence by 2020 with at least $3 million.


By Topics

Overall:
0. About (10)
1. My Progress (139)
2. Car & Home (107)
3. Credit (138)
4. Banking (33)
5. Saving (49)
6. Investing (308)
7. Taxes (89)
8. Spending (74)
9. Misc (97)
A. Archive (49)


MONTHLY ARCHIVE

Feb 2014 (3)
Jan 2014 (6)
Jan 2012 (1)
Apr 2011 (1)
Mar 2011 (1)
Feb 2011 (1)
Jan 2011 (1)
Dec 2010 (1)
Oct 2010 (1)
Sep 2010 (1)
Aug 2010 (1)
Jul 2010 (1)
Jun 2010 (1)
May 2010 (1)
Apr 2010 (1)
Mar 2010 (6)
Feb 2010 (2)
Jan 2010 (7)
Dec 2009 (3)
Feb 2009 (4)
Jan 2009 (8)
Dec 2008 (1)
Jun 2008 (2)
May 2008 (2)
Apr 2008 (5)
Feb 2008 (3)
Jan 2008 (15)
Dec 2007 (32)
Nov 2007 (6)
Oct 2007 (8)
Sep 2007 (9)
Aug 2007 (24)
Jul 2007 (2)
Jun 2007 (1)
May 2007 (3)
Apr 2007 (4)
Mar 2007 (4)
Feb 2007 (13)
Jan 2007 (6)
Dec 2006 (3)
Nov 2006 (7)
Oct 2006 (7)
Sep 2006 (6)
Aug 2006 (4)
Jul 2006 (10)
Jun 2006 (1)
May 2006 (3)
Apr 2006 (2)
Mar 2006 (6)
Feb 2006 (6)
Jan 2006 (3)
Dec 2005 (1)
Nov 2005 (9)
Oct 2005 (8)
Sep 2005 (13)
Aug 2005 (25)
Jul 2005 (16)
Jun 2005 (17)
May 2005 (19)
Apr 2005 (20)
Mar 2005 (24)
Feb 2005 (23)
Jan 2005 (36)
Dec 2004 (40)
Nov 2004 (34)
Oct 2004 (17)
Sep 2004 (21)
Aug 2004 (59)
Jul 2004 (37)
Jun 2004 (31)
May 2004 (29)
Apr 2004 (52)
Mar 2004 (49)
Feb 2004 (49)
Jan 2004 (31)
Dec 2003 (48)
Nov 2003 (52)
Oct 2003 (29)
Sep 2003 (8)
Aug 2003 (5)
Jul 2003 (2)
Jun 2003 (2)
May 2003 (5)
Apr 2003 (2)
Mar 2003 (2)
Feb 2003 (3)
Jan 2003 (29)


Losing 37% a Year for 10 Years Straight

Contributed by mm | January 25, 2010 2:15 PM PST

6396-crash.jpgYes, the past decade of 2000s didn't treat investors well. If you invested in the DJIA, you lost 9% for the decade. A S&P 500 investor lost 24%. And a NASDAQ investor lost 44%, thanks to the fact that we started the decade at the height of the dot com bubble.

All the above figures are absolute, un-annualized returns. That is, your original 10,000 dollar investment will end up at approximately $9,100, $7,600, and $5,600 respectively.

But how about losing at an annualized rate of 37% a year for 10 years?

That's what Frontier MicroCap (FEFPX) has managed to treat its investors. If your crystal ball had guided you to the fund back in 2000, every $10,000 of your original investment have become, well, 98 cents.

6396-FEFPX.jpg

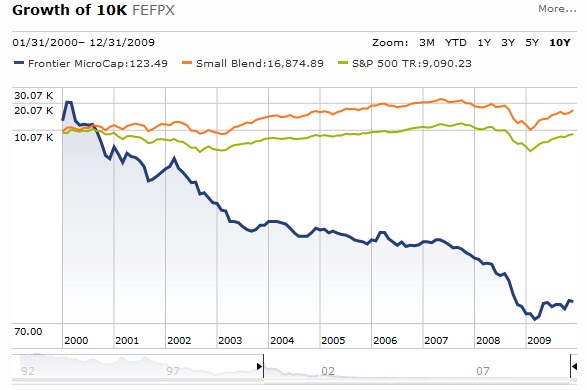
The fund, which almost doubled its investor money in the first few months of the decade just before the dot com crash, fell all the way down since then.

With a remaining total asset of only $53,559 (yes, in dollars, not in thousands), the fund chose to close shop. The NAV of the fund is $0.04 per share for its 1.5M shares before it ceased trading.

How did it happen? A look at its last annual report will shed some light on the downward trajectory of this fund that managed to lose almost every single dollar of fund investor's money:

1) The fund invested in a bunch of penny shares. Of course this is a "MicroCap" fund so that's what it is supposed to do. But any micro-cap investor should know this segment of the market is probably the most risky.

2) The fund applies some leverage. As of September 30, 2009, the fund has a leverage of about 1.5x.

3) And when its asset base dwindled, the multitude of expenses that are needed to keep a fund running became intolerable. In the last 12 months, the fund has an astonishing annualized expense ratio of 72%. Advisory fees, transfer agent fees, audit fees, legal fees, custodian fees, trustee fees, registration, printing and mailing, insurance and other miscellaneous fees added up to a total of $41,049 even though the fund advisors waived advisory fee of $844 as an insignificant gesture.

After studying the annual report, I think the fund probably already passed the point of no return five years ago when the expense ratio was 15% in 2005, and the ratio grew up every year since that. It is therefore the greed of the many involved parties that kept it running until the last moment.

The lesson: it is probably very difficult to identify a fund that will win you big in the next decade, but it is not that difficult to identify one that will cost you big. Key traits of a loser: niche and risky segment, small asset base, leverage, and greedy management.

More PFBlog Articles You Might Find Interesting ...


This Post Has Received 6 Comments. Share Your Opinions Too.


Add Your Comments


Remember personal information?

Help to reduce spam


China Barrons Commented on January 26, 2010

I would suggest you visit GMO's website. Jeremy Grantham predicted and explained it all. Look at his 7 year asset class return prjections.


Juan Batista Commented on February 2, 2010

Some one should put the thing out of its misery.


ddd@yahoo.com Commented on February 3, 2010

interesting. you are here when times are good. then you disapear when times are bad. then you come back when stuff rebounds. Your blog would be 10X better if give your comentary in good times and bad. that my ohh too.


sfgirl Commented on February 4, 2010

Interesting Insight.


jim Commented on February 4, 2010

We probably won't see you for a while now that the stock market is hitting turbulence again. What a worthless blog. Kill it.


sfgirl Commented on February 6, 2010

Good insight!


Read More ... 308 Posts In The Same Category


This page was last rebuilt at January 27, 2014 07:32 AM PST.
 

RSS FEED


PERSONAL FINANCE BLOGS I READ

Consumerism Commentary
Get Rich Slowly
My Money Blog
All Financial Matters
The Simple Dollar


.

Error 500 - Internal server error

Error 500 - Internal server error

An internal server error has occured!
Please try again later.


Copyright 2003-2014, PFBlog.com. All Rights Reserved. (Privacy Policy)