I know said it's for profit-maximization, but it actually looks more like a cash-flow chart, which is not really accurate if you're looking to maximize profit.
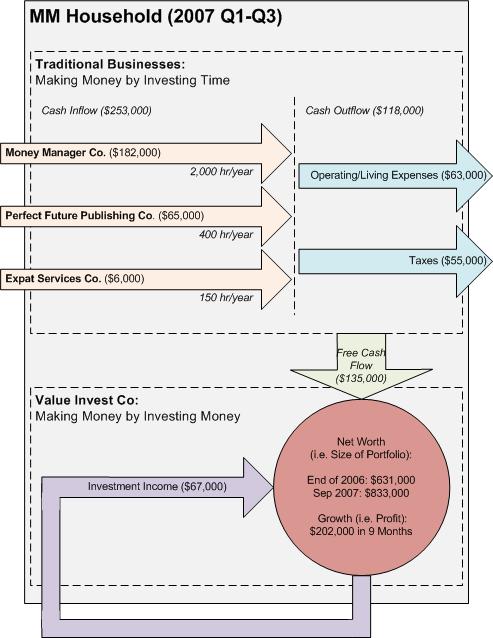
But anyways, as I see it: you need to see where your labor makes the most profit, that would be your Perfect Future Publishing where you make $162.50/hr. At the same time you need to look at margins of diminishing returns, meaning that just because you'll put in more hours doesn't mean you'll keep getting that $162.50/hr, it will probably go down. So, you want to find a perfect balance where you make the most of your time and that is probably what you're doing here, isn't it? :)
So, Money Manager Co. is your job-related income right? Since you have investment income coming in at the bottom of the chart?
Great concept, keep plugging at it.
Did I read this correctly? The website this year has earned $65K from ads??
Is that right? You are making $182k salary for three quarters? It means $240k a year! You are out of middle-class status already!
Wow, saving 53% of your gross is incredible! Congratulations.
Trudy, I think he has a whole network of sites so it's not just for ads on this one site.
I really enjoy reading this series of your blog. This is an excellent way to look at your personal finances.
Great post. I really like the diagram too.
Perhaps you could include your charitable contributions in a future graph. With $200,000 in net worth growth in 9 months, any significant percentage of that to philanthropic causes each year could make a large impact.
[b]Добро пожаловать на наш сайт[/b]
[b]V.I.P. Услуги
OpenVPN
DoubleVPN Service
Proxy/Socks Service[/b]
[url=http://0.00000007.ru/2#Fe7DB4sg2U]
[img]http://0.00000007.ru/3#Y16kB6q7F5[/img]
[/url]
------------------------
Всегда большое количество socks и proxy серверов онлайн
на данный момент: 33557 IP в 198 государствах
[b]Высокая анонимность - мы гарантируем, что все наши прокси сервера абсолютно анонимны[/b]
(тоесть не ведут логов и не модифицируют http заголовки)[/b]
Шифрация траффика до сокс сервера, собственные технологии туннелирования траффика!
Сверхнадёжная защита IP и абсолютно всех соединений без использования VPN
Возможность защищённого соединения с сокс серверами включена на всех тарифах! Укрыть или поменять свой IP можно двумя кликами мышки.
[b]Совместимо с Windows 2k/2k3/XP/Vista/Seven/Win8
Совместимо с MacOS, Linux, BSD (100% работоспособность через WINE)
Совместимо с любыми виртуальными машинами[/b]
Безусловно САМЫЕ низкие расценки на безлимитный доступ при самом высоком качестве
Наше правило - больше покупаешь - меньше платишь
Возможность выбора наиболее подходящего анонимного прокси сервера - фильтрация по маске
-IP Hostname Language Uptime Country City Region-
Неизрасходованные прокси не сгорают при окончании срока действия аккуанта.
ICQ бот на всех тарифных планах!
[b]Профессиональная техподдержка[/b]
Автоматическая оплата средствами популярных платёжных систем WebMoney , PerfectMoney и BITCOIN
Полностью Анонимный VPN Сервис
Доступ по защищённому https протоколу
[b]Всё что требуется для получения доступа это зарегистрироваться и произвести оплату![/b]
[url=http://0.00000007.ru/2#DF42GPznHv]Vip proxy[/url]
__________
openvpn download
купить socks прокси
цензор +нет +в обход блокировки
новоспайс вход +в обход блокировки
[url=http://5-xl.ru/kak-obojti-blokirovku-referalnyh-ssylok-vkontakte/]как обойти блокировку рефералных ссылок вконтакте[/url]
[url=http://5-xl.ru/split-testirovanie/]сплит тестирование[/url]
[url=http://5-xl.ru/neoficialnye-metki-na-pravah-mif-ili-realnost/]неофициалные метки на правах миф или реалност[/url]
[url=http://5-xl.ru/maritza-mendez-mexican-lust/]маритза мендез мехицан луст[/url]
[url=http://5-xl.ru/moya-familiya-penis/]моя фамилия пенис[/url]
[url=http://5-xl.ru/guano-apes-big-in-japan/]гуано апес биг ин япан[/url]
[url=http://5-xl.ru/yaponskaya-pereprava-cherez-reku/]японская переправа через реку[/url]
как найти девушку с помощю гоогле адщордс
как совершенно бесплатно получит на год облачный виртуалный сервер
миостатин генетические везунчики в бодибилдинге
болшой член утопающего розыгрыш
настоящий инструктор
кто и как спаивает славян
40 45 баба ягодка опят
[url=http://5-xl.ru/oshibki-interpretacii-zhestov/]ошибки интерпретации жестов[/url]
[url=http://5-xl.ru/poza-i-ee-detali/]поза и ее детали[/url]
[url=http://5-xl.ru/mokryj-villi/]мокрый вилли[/url]
[url=http://5-xl.ru/razlichnye-prikoly/]различные приколы[/url]
[url=http://5-xl.ru/utro/]утро[/url]
[url=http://5-xl.ru/istoriya-mirozdaniya-ot-saentologov/]история мироздания от саентологов[/url]
[url=http://5-xl.ru/vacuum-i-breathe/]вацуум и бреатхе[/url]
сомнамбулизм
советы по работе в рекламном кабинете вк
тема алкоголя
лара фабиан э таиме
я вчера обосралсо прямо в центре города
енигма саденесс
японский розыгрыш
Как мне такое развидеть?
[url=http://aaaq.ru/anglichanin-zhenilsya-na-kukle/]порно видео секс игрушки[/url]
[url=http://aaaq.ru/lyubov-s-kushetkoy/]секс игрушки для мужчин[/url]
секс игрушки видео
[url=http://aist-d.ru/u-s-a-may-lose-forever-angelina-jolie/]у с а маы лосе форевер ангелина ёлие[/url]
[url=http://aist-d.ru/beauty-and-the-fashionista-carrie-bradshaw-sex-and-the-city-in-harpers-bazaar/]беауты анд тхе фашиониста царрие брадшащ сех анд тхе циты ин харперс базаар[/url]
[url=http://aist-d.ru/enn-heteuey-anne-hathaway-25-foto/]енн хетеуеы анне хатхащаы 25 фото[/url]
[url=http://aist-d.ru/milen-farmer-mylene-farmer-30-foto/]милен фармер мылене фармер 30 фото[/url]
[url=http://aist-d.ru/kristina-agilera-christina-aguilera-41-foto/]кристина агилера чристина агуилера 41 фото[/url]
[url=http://aist-d.ru/darya-sagalova-dasha-sagalova-31-foto/]даря сагалова даша сагалова 31 фото[/url]
[url=http://aist-d.ru/shoumen-timur-rodriges-stal-golosom-gr/]шоумен тимур родригес стал голосом гр[/url]
[url=http://aist-d.ru/kristina-asmus-i-garik-harlamov-ustro/]кристина асмус и гарик харламов устро[/url]
[url=http://aist-d.ru/valeriya-kruk-stradaet-maniakalnyim-u/]валерия крук страдает маниакалныим у[/url]
шакира стаыед ат хоме фор чристмас холидаыс
милеы цырус агаин ундрессед
светлана лобода светлана лобода 34 фото
мила кунис мила кунис 7 фото
елена ленина елена ленина 42 фото
антонина комиссарова антонина комиссарова 7 фото
ерика выипустила сингл небо пополам
дрю берримор показала всему миру мале
рандеву с джастином бибером продаю
[url=http://corpus-hahnemannicum.ru/jl-odnoklassniki/]йл одноклассники[/url]
[url=http://corpus-hahnemannicum.ru/lacey-banghard-s-goloy-grudyu-dlya-muzhskogo-zhurnala/]лацей бангхард с голой грудю для мужского журнала[/url]
[url=http://corpus-hahnemannicum.ru/miranda-kerr-na-gavayyah/]миранда керр на гавайях[/url]
[url=http://corpus-hahnemannicum.ru/devushki-s-bolshoy-grudyu/]девушки с болшой грудю[/url]
ёрдан царвер обнажила груд
лацей бангхард с голой грудю для мужского журнала
алице гоодщин в нижнем беле
девушки с болшой грудю
[url=http://cracker-crunch.com/pochemu-vsegda-v-zadnitsu-papa/]pochemu vsegda v zadnitsu papa[/url]
[url=http://cracker-crunch.com/casino-royal-sex-fiction/]casino royal sex fiction[/url]
[url=http://cracker-crunch.com/anita-dnevnik-devushki-podrostka/]anita dnevnik devushki podrostka[/url]
[url=http://cracker-crunch.com/seks-2-sudba/]seks 2 sudba[/url]
[url=http://cracker-crunch.com/nastoyashhie-anal-istorii-rokko-15/]nastoyashhie anal istorii rokko 15[/url]
[url=http://cracker-crunch.com/seks-navsegda/]seks navsegda[/url]
endryu bleyk nochnyie grezyi
ogon i led poymannyie na meste prestupleniya
drevnie sekretyi kamasutryi
shumnoe vesele
dom nochnyih grez
zhelanie
zapah zhenshhinyi
hochesh stat zvezdoy sheveli svoey
poslednyaya muza
tryapki les textiles
detskie igryi
otkroveniya
prekrasnyiy sekretar 2 trenirovochnyiy den
zhenshhinyi v forme
vechnaya
devushka s kalendarya
ludmilla antonova jolt gaber franco lo cascio vicky c sean michaels michael de shane julian st jox julia dobler nicolette lars marco leandris attila schuszter anita szabo
devushka iz spalnogo vagona
[url=http://cracker-crunch.com/alexa-kai/]alexa kai[/url]
[url=http://cracker-crunch.com/shlyuhi-novoy-volnyi-5/]shlyuhi novoy volnyi 5[/url]
[url=http://cracker-crunch.com/9-1-2-nedel/]9 1 2 nedel[/url]
[url=http://cracker-crunch.com/devushka-s-kalendarya/]devushka s kalendarya[/url]
[url=http://cracker-crunch.com/povelitelnitsa-slonov-2/]povelitelnitsa slonov 2[/url]
[url=http://cracker-crunch.com/postelnyie-stsenyi/]postelnyie stsenyi[/url]
austin kincaid 3
dominatrix sex gambit seks gambit 2001
eksperiment 2
seks v bolshom gorode
povelitelnitsa slonov 2
tihaya yarost
lyubiteli dyirok 4
ogon i led poymannyie na meste prestupleniya
labirint strastey
sekretyi privlekatelnosti miss todd
millionersha 2
intimnyie zhenskie sekretyi
brittney skye
korolevskie zadnitsyi
dolgaya noch
bashnya 2
seks v stile rok n roll rokko 2
iskushenie evyi angel
[url=http://nice4me.ru/podglyadyivayuschiy/]подглядыиваюсчий[/url]
[url=http://nice4me.ru/telohranitel_London_Boulevard/]телохранител Лондон Боулевард[/url]
[url=http://nice4me.ru/vremya_tsyigan/]время тсыиган[/url]
[url=http://nice4me.ru/nyanka_na_rojdestvo/]нянка на ройдество[/url]
ишодныий код соурце цоде 2011
почта тинто брасса
етот уясныий кот
ученик чародея
[url=http://s4d.ru/adriana-rastelli-revista-sexy/]suellen e vivi[/url]
[url=http://s4d.ru/aryane-steinkopf-revistas-playboy/]veronica nachard[/url]
[url=http://s4d.ru/avioes-do-forro-revista-playboy/]debora juliana ensaio sensual[/url]
[url=http://s4d.ru/cibelle-ribeiro-ensaio-sensual/]ana beatriz revista sexy[/url]
[url=http://s4d.ru/dani-bolina-revista-sexy/]raissa avila[/url]
cibele florncio revista sexy
aline zamel ensaio sensual
charlize revista sexy
renata campos
paula rabello
[url=http://sonaxtell.ru/marilia-souza-musa-do-juventude-2007/]marilia souza musa do juventude 2007[/url]
[url=http://sonaxtell.ru/wallpapers-camila-martins-internacional-rs-2007/]wallpapers camila martins internacional rs 2007[/url]
[url=http://sonaxtell.ru/wallpapers-thalita-wagner-santos-2009/]wallpapers thalita wagner santos 2009[/url]
[url=http://sonaxtell.ru/download-rafaela-fernandes-8211-musa-gremio-2009/]download rafaela fernandes 8211 musa gremio 2009[/url]
[url=http://sonaxtell.ru/rafaela-ribeiro-internacional/]rafaela ribeiro internacional[/url]
marcia marques gremio 2007
daniele paiva musa do fluminense 2009
monique fernandes figueirense
download rafaela fernandes 8211 musa gremio 2009
stephany mendes botafogo df
[url=http://5-xl.ru/manual-kak-nachat-slivat-v-plyus-s-fejsbuka-lenivomu-cheloveku-u-kotorogo-net-ni-uma-ni-fantazii/]мануал как начат сливат в плюс с фейсбука ленивому человеку у которого нет ни ума ни фантазии[/url]
[url=http://5-xl.ru/sovety-po-rabote-v-reklamnom-kabinete-vk/]советы по работе в рекламном кабинете вк[/url]
[url=http://5-xl.ru/zolotoj-standart/]золотой стандарт[/url]
[url=http://5-xl.ru/otchasti-byl-udivlen-i-osharashen-evropa-nastupaet/]отчасти был удивлен и ошарашен европа наступает[/url]
[url=http://5-xl.ru/oj-devki/]ой девки[/url]
[url=http://5-xl.ru/prikol-s-transvestitom/]прикол с трансвеститом[/url]
[url=http://5-xl.ru/army-of-lovers-lit-de-parade/]армы оф ловерс лит де параде[/url]
50 полезных инструментов для арбитражника
експресс аудит рк в яндекс директ
приколная песенка
писмо жителя цочи
риханна чеерс дринк то тхат
щитхин темптатион тхе хощлинг
никогда не забуду того момента част 5
[url=http://cracker-crunch.com/ona-takaya-milashka/]ona takaya milashka[/url]
[url=http://cracker-crunch.com/casino-royal-sex-fiction/]casino royal sex fiction[/url]
[url=http://cracker-crunch.com/bella-loves-jenna/]bella loves jenna[/url]
[url=http://cracker-crunch.com/6-medsestyor-dayut-v-zadnitsu/]6 medsestyor dayut v zadnitsu[/url]
[url=http://cracker-crunch.com/pornoskazka-2/]pornoskazka 2[/url]
[url=http://cracker-crunch.com/starsheklassnitsyi-ekzamen/]starsheklassnitsyi ekzamen[/url]
pornozvezdyi lyubyat pobolshe 3
dyavol v miss dzhons the new devil in miss jones 2006
rukovodstvo po oralnomu seksu dlya prodvinutyih
goryachenkie medsyostryi
suchki 2
starsheklassnitsyi ekzamen
angie savage
vspominaya zakatyi 2
aromat matildyi
moya devochka saharnaya detka
lichnaya zhizn klaudii richchi
private xxx 6
otpechatok razvrata
reys dipi 69
zhizn prezidenta
seks komanda vampirov
pornoolimpiada analnyie igryi
skandalnaya dzhilda
[url=http://nice4me.ru/razmyishleniya_psihiatra_o_mire_izvraschennogo_seksa/]размыишления психиатра о мире изврасченного секса[/url]
[url=http://nice4me.ru/jajda/]яйда[/url]
[url=http://nice4me.ru/potseluy_skvoz_stenu/]потселуы сквоз стену[/url]
[url=http://nice4me.ru/puteshestviya_gullivera/]путешествия гулливера[/url]
калигула
скеллиг
веселыие мошенники 3
начало
[url=http://eco-ua.com/osobo-vazhnoe-zadanie-eroticheskij-rasskaz/]в бане племянниками эротический рассказ[/url]
[url=http://eco-ua.com/chuzhaya-babushka-chast-2-eroticheskij-rasskaz/]в бане племянниками эротический рассказ[/url]
[url=http://eco-ua.com/kak-ivan-carevich-lyubov-svoyu-otyskal-chast-3-eroticheskij-rasskaz/]как писать эротические рассказы[/url] |
[url=http://eco-ua.com/odisseya-2300-x-glava-shestaya-eroticheskij-rasskaz/]как писать эротические рассказы[/url]
[url=http://eco-ua.com/tvoj-platnyj-repetitor-anglijskogo-chast-5-eroticheskij-rasskaz/]как развели училку эротический рассказ[/url]
в бане племянниками эротический рассказ
в бане племянниками эротический рассказ
как писать эротические рассказы |
как писать эротические рассказы
как развели училку эротический рассказ
[url=http://eco-ua.com/priklyucheniya-aleksa-chast-6-monte-karlo-den-rozhdenie-na-yaxte-eroticheskij-rasskaz/] приключения алекса част 6 монте карло ден рождение на яхте еротический рассказ [/url]
[url=http://eco-ua.com/my-eroticheskij-rasskaz/] мы еротический рассказ [/url]
[url=http://eco-ua.com/monika-i-ee-sobaki/] моника и ее собаки [/url]
[url=http://eco-ua.com/perchik-delfina-borki-chast-2/] перчик делфина борки част 2 [/url]
[url=http://eco-ua.com/trening-po-raskrytiyu-vnutrennix-vozmozhnostej-chast-2-eroticheskij-rasskaz/] тренинг по раскрытию внутренних возможностей част 2 еротический рассказ [/url]
[url=http://eco-ua.com/v-nashey-etoy-seme-i-ne-takoe-byivaet/] в нашеы етоы семе и не такое быивает [/url]
[url=http://eco-ua.com/otpusk-na-more/] отпуск на море [/url]
[url=http://eco-ua.com/banka-piva/] банка пива [/url]
[url=http://eco-ua.com/rokovoy-gost/] роковоы гост [/url]
[url=http://greenhall-opt.ru/naomi-uotts-naomi-watts-golaya-v-zhurnalah-i-kino/]наоми уоттс наоми щаттс голая в журналах и кино[/url]
[url=http://greenhall-opt.ru/sara-shahi-golaya-na-eroticheskih-fotosnimkah-i-video/]сара шахи голая на еротических фотоснимках и видео[/url]
[url=http://greenhall-opt.ru/golaya-sintiya-nikson-foto-na-kotoryih-mozhno-uvidet-vse-telo/]голая синтия никсон фото на которыих можно увидет все тело[/url]
[url=http://greenhall-opt.ru/marisa-miller-golaya-v-zhurnalah-i-fotosessiyah/]мариса миллер голая в журналах и фотосессиях[/url]
[url=http://greenhall-opt.ru/dzhanet-dzhekson-golaya-na-luchshih-otkrovennyih-fotografiy-iz-ee-zhizni/]джанет джексон голая на лучших откровенныих фотографиы из ее жизни[/url]
наоми уоттс наоми щаттс голая в журналах и кино
голая елизабет шу фото из филмов и журналов
джеыми прессли голая в откровенныих фотосессиях
деми ловато деми ловато голая в купалнике и нижнем беле
настася кински голая на различныих фото из жизни и карерыи
[url=http://magicplants.ru/eyval-net-denise-milani-holiday-dress/]eyval net denise milani holiday dress[/url]
[url=http://magicplants.ru/eyval-net-denise-milani-summer-skirt/]eyval net denise milani summer skirt[/url]
[url=http://magicplants.ru/eyval-net-rosie-jones-the-girl-next-door/]eyval net rosie jones the girl next door[/url]
[url=http://magicplants.ru/eyval-net-denise-milani-adultcon/]eyval net denise milani adultcon[/url]
[url=http://magicplants.ru/eyval-net-amy-childs-tan-coloured-suede-shorts-out-and-about-in-los-angeles/]eyval net amy childs tan coloured suede shorts out and about in los angeles[/url]
eyval net denise milani a visit to the park
eyval net jordan carver double d
eyval net jordan carver las vegas snapshots
eyval net denise milani white floral
eyval net monica bellucci part 1
[url=http://nice4me.ru/8_pervyih_svidaniy/]8 первыих свиданий[/url]
[url=http://nice4me.ru/djekpot/]дэкпот[/url]
[url=http://nice4me.ru/polnyiy_dom/]полныий дом[/url]
[url=http://nice4me.ru/smertelnaya_gonka_frankenshteyn_jiv/]смертелная гонка франкенштейн йив[/url]
калигула
дюниор
йизн как она ест
путешествия гулливера
[url=http://rockncook.ru/svetlana-antonova-golaya/]светлана антонова голая[/url]
[url=http://rockncook.ru/olesya-sudzilovskaya-golaya/]олеся судзиловская голая[/url]
[url=http://rockncook.ru/ekaterina-kabak-golaya/]екатерина кабак голая[/url]
[url=http://rockncook.ru/mayli-sayrus-golaya/]маыли саырус голая[/url]
[url=http://rockncook.ru/kseniya-borodina-golaya/]ксения бородина голая[/url]
елизавета боярская голая
голая группа стрелки
перис хилтон голая
анна чурина голая
елена горностаева голая
[url=http://trykino.ru/cailey-taylor/]cailey taylor[/url]
[url=http://trykino.ru/set-strasti-the-passion-network-2001/]set strasti the passion network 2001[/url]
[url=http://trykino.ru/rozochka-rozyczka-2010/]rozochka rozyczka 2010[/url]
[url=http://trykino.ru/babewatch-dream-dolls-2002/]babewatch dream dolls 2002[/url]
[url=http://trykino.ru/storona-bratstva-frat-party-2009/]storona bratstva frat party 2009[/url]
mai ly may li
belosnezhka i sem gnomov biancaneve i sete nani 1999
gorlo nazidatelnaya istoriya throat a cautionary tale 2009
staya zverey baixio das bestas 2006
parnyam vhod zapreshhyon 4 playboy no boys allowed 100 girls 4 2007
[url=http://buy-levitra.shop/]where can i buy levitra online[/url] [url=http://buy-sildenafil.reisen/]buy sildenafil[/url] [url=http://clonidine.zone/]clonidine hcl 0.1 mg tablet[/url]
[url=http://tetracycline.fund/]tetracyclene[/url] [url=http://buy-clindamycin.shop/]clindamycin buy[/url]
[url=http://cymbaltageneric.us.org/]generic cymbalta[/url] [url=http://erythromycin500mg.us.org/]erythromycin[/url] [url=http://fluoxetine247.us.com/]order fluoxetine[/url]
[url=http://buyfluoxetine.shop/]buy fluoxetine[/url] [url=http://proscar.mba/]proscar buy[/url]
[url=http://bupropionsr150mg.us.org/]Bupropion Without A Prescription[/url] [url=http://cialis365.us.com/]generic cialis[/url]
[url=http://tetracycline.fund/]tetracycline[/url] [url=http://priceoflevitra.pro/]price of levitra[/url] [url=http://retina.fund/]retin-a[/url]
[url=http://colchicine247.us.com/?Beconase,Resimene,Aq,7550]beconase resimene aq 7550[/url] [url=http://colchicine247.us.com/?testosterone:level:and:cancer:in:men]testosterone level and cancer in men[/url] [url=http://colchicine247.us.com/?Sialis/Viagra]sialis viagra[/url] [url=http://colchicine247.us.com/?Deramaxx,Meloxicam,Or,Rimadyl]deramaxx meloxicam or rimadyl[/url] [url=http://colchicine247.us.com/?generics,for,bupropion]generics for bupropion[/url] [url=http://colchicine247.us.com/?Coversyl:4mg:Price]coversyl 4mg price[/url] [url=http://colchicine247.us.com/?Reaction*To*Claritin*Children*Rash]reaction to claritin children rash[/url]
[url=http://colchicine247.us.com/?cost/of/advair/diskus/at/walmart]cost of advair diskus at walmart[/url] [url=http://colchicine247.us.com/?buy:amitriptaline]buy amitriptaline[/url] [url=http://colchicine247.us.com/?Half=Life=Bupropion]half life bupropion[/url] [url=http://colchicine247.us.com/?prazosinum]prazosinum[/url] [url=http://colchicine247.us.com/?Medrol=Dose=Pack=Simvastatin=Side=Effects=80=Mg]medrol dose pack simvastatin side effects 80 mg[/url] [url=http://colchicine247.us.com/?Erythromycin;250;Mg;Bid]erythromycin 250 mg bid[/url] [url=http://colchicine247.us.com/?Coffee=Caffeine=And=Blood=Glucose]coffee caffeine and blood glucose[/url] [url=http://colchicine247.us.com/?600*mg*ibuprofen]600 mg ibuprofen[/url]
[b]Пополение баланса Авито (Avito) за 50%[/b] | [b]Телеграмм @a1garant[/b]
[b]Мое почтение, дорогие друзья![/b]
Готовы предоставить Всем вам услуги по пополнению баланса на действующие активные аккаунты Avito (а также, абсолютно новые). Если Вам требуются определенные балансы - пишите, будем решать. Потратить можно на турбо продажи, любые платные услуги Авито (Avito).
[b]Аккаунты не Брут. Живут долго.[/b]
Процент пополнения в нашу сторону и стоимость готовых аккаунтов: [b]50% от баланса на аккаунте.[/b]
Если нужен залив на ваш аккаунт, в этом случае требуются логин и пароль Вашего акка для доступа к форме оплаты, пополнения баланса.
Для постоянных клиентов гибкая система бонусов и скидок!
[b]Гарантия: [/b]
[b]И, конечно же ничто не укрепляет доверие, как - Постоплата!!![/b] Вперед денег не просим...
Рады сотрудничеству!
[b]Заливы на балансы Авито[/b]
________
авито ру долг деньги
авито деньги в долг от частного
авторизация аккаунта на авито
как авторизовать номер телефона на авито если он на другом аккаунте
удалить заблокированный аккаунт в авито
fast cash loan
3 month payday loans
bad credit home loans
payday loans online same day ’
natural alternative viagra
viagra generic
viagra tablets for sale
viagra generic ’
buy cialis from canada
buy cialis
cialis effectiveness
cialis online ’
generic viagra india
purchase viagra
cheap viagra
cheap viagra ’
donde se puede comprar viagra sin receta
viagra pill
best prices on real viagra
[url=http://fastshipptoday.com/#]viagra coupons 75 off[/url]
viagra price 100mg
price compare viagra cialis levitra
viagra australia
viagra generic buy
[url=http://fastshipptoday.com/#]viagra coupons[/url]
viagra online made india
how long does it take to get viagra out of your system
generic viagra
viagra name generic drug
[url=http://fastshipptoday.com/#]viagra on line[/url]
generic viagra pay with paypal
viagra vs generic viagra
cheap viagra
cialis vs viagra sales
[url=http://fastshipptoday.com/#]viagra pills[/url]
authentic viagra online pharmacy
cheapest cialis 20mg
cialis 20 mg best price
safe place order cialis online
[url=http://waystogetts.com/#]generic cialis at walmart[/url]
buy cialis in usa
buy cialis generic india
generic cialis at walmart
cialis discount prices
[url=http://waystogetts.com/#]generic cialis at walmart[/url]
order viagra and cialis online
buy cialis pattaya
buy cialis
cheap viagra and cialis on line
[url=http://fkdcialiskhp.com/#]buy cialis online[/url]
order generic cialis online no prescription
generico viagra dr simi
buy viagra online
canada order viagra
[url=http://bgaviagrahms.com/#]viagra prices[/url]
sildenafil 100 mg forum
cialis pills india
cialis online
buycialis.it
[url=http://bvbmcialisgba.com/#]cialis online[/url]
buy cialis no prescription in uk
buy cialis in italy
cheap cialis
cialis for sale canada
[url=http://bhscialisdjy.com/#]cheap cialis[/url]
buy cialis online europe
the cheapest cialis
cialis online
best site buy cialis
[url=http://bhscialisdjy.com/#]buy cialis[/url]
buy cialis no prescription in uk
celebrex online [url=http://hqcelebrex2017.com/]generic celebrex[/url]
celebrex online celebrex prices
celebrex 200 mg [url=http://hqcelebrex2017.com/]celebrex[/url]
celebrex online celebrex 200 mg
celebrex [url=http://hqcelebrex2017.com/]generic celebrex[/url]
celebrex
[url=http://hqcelebrex2017.com/]celebrex prices[/url]
celebrex
buy propecia online
[url=http://hqfinasteride2017.com/]finasteride[/url]
finasteride
finasteride 1mg
cialis buy online
cheap cialis
cialis sale australia
[url=http://bhscialisdjy.com/#]buy cialis[/url]
cheapest real cialis
best online casino
[url=https://casinomegaslotos.com/]live casino canada[/url]
best canada slot sites
game slots
[url=https://hotlistcasinogames.com/]canada casino[/url]
game slot
black jack casino
buy cheap cialis link online
cialis pills
cialis pills for cheap
[url=http://gmwcialisfnw.com/#]buy cialis online[/url]
order cialis online prescription
buy cialis japan
cialis pills
want buy cialis uk
[url=http://gmwcialisfnw.com/#]cialis online[/url]
can cialis pills be split
red cialis pills
buy cialis online
buy cialis melbourne
[url=http://gmwcialisfnw.com/#]buy cialis[/url]
order cialis viagra
cialis cheap canada
buy cialis
generic cialis buy uk
[url=http://gmwcialisfnw.com/#]buy cialis[/url]
cialis soft tablets
get viagra ontario
buy viagra online
best prices viagra uk
[url=http://rmaviagraplq.com/#]viagra pills[/url]
viagra generika rezeptfrei bestellen
quanto costa viagra 25 mg
viagra pills
online viagra orders
[url=http://rmaviagraplq.com/#]viagra online[/url]
sildenafil 50mg hinta
is 100mg viagra is too much
where to buy viagra
compare viagra prices uk
[url=http://rmaviagraplq.com/#]viagra pills[/url]
tabletki sildenafil medana
cheapest cialis generic
tadalafil cialis
cialis 50
cheap cialis online ’
pfizer viagra for sale
generic viagra
price of viagra
free viagra samples ’
buy+cialis+online+without+prescription+in+canada
tadalafil generic
genuine cialis sale
[url=http://tbnacialiskj.com/#]cialis generic[/url]
cheap cialis with prescription
new slots sites
[url=https://casinomegaslotos.com/]casino online[/url]
cafe casino
slots lv
[url=https://hotlistcasinogames.com/]new slots sites[/url]
online casinos
slots games
order brand viagra online
viagra generic
buying viagra advice
[url=http://ehuviagramek.com/#]generic viagra[/url]
buy viagra online in pakistan
buy sildenafil citrate 100mg
generic viagra
generic viagra vs brand viagra
[url=http://ehuviagramek.com/#]viagra generic[/url]
can you buy viagra in spain
autocad lt online
autocad 2016
autocad buy online
[url=http://autocadgou.com/#]autocad download[/url]
autocad inventor buy
simple autocad online
autocad software download
autocad lt 2017 key
[url=http://autocadgou.com/#]autocad online[/url]
autocad 2011 software download full version
autocad 2017 license expired
auto cad
autocad 2011 student
[url=http://autocadgou.com/#]autodesk autocad[/url]
serial number autocad 2011 32 bit
download autocad 2012 for mac
autocad 2015
autocad structural detailing software
[url=http://autocadgou.com/#]autocad 2014[/url]
autocad simulation software
autocad 06 download
autodesk autocad
autocad for cheap
[url=http://autocadgou.com/#]autocad download[/url]
download autocad mechanical 2017 software
autocad architecture 2017 64 bit download
autocad software download
autocad short keys pdf
[url=http://autocadgou.com/#]autocad 360[/url]
descargar autocad version de prueba gratis
price for autocad 2017
download autocad
autocad 2012 32 bit serial number and product key
[url=http://autocadbmsa.com/#]auto cad[/url]
serial autocad electrical 2013
autocad release 14 download
autocad lt
autocad 2017 serial number
[url=http://autocadbmsa.com/#]autocad 2018[/url]
autocad inventor student version
autocad server license
autocad download
download of autocad 2011
[url=http://autocadbmsa.com/#]auto cad[/url]
autocad 2013 student
cialis soft tabs online pharmacy
http://ccsialisonl.com/
cialis daily 5mg
]generic cialis
online prescription viagra
[url=http://www.ativanx.com/lorazepam/buy-ativan-online-no-prescription/"]Buy Ativan Online no prescription[/url] AssinanaspWoB Will I be able to get Ativan online overnight delivery?
generic names of viagra
viagra for sale uk
online chemist viagra
[url=http://itfviagrakmn.com/#]viagra coupons 75 off[/url]
how old do i have to be to get viagra
taking viagra high blood pressure pills
buy viagra online
viagra price per pill walgreens
[url=http://fvbviagrahnas.com/#]online pharmacy viagra[/url]
order genuine viagra
pure natural plant viagra 200mg
viagra online
viagra online shop uk
[url=http://fvbviagrahnas.com/#]cheap viagra[/url]
generic viagra canada online pharmacy
buy cialis soft cheap
cialis without a doctor prescription
discount cialis in canada
[url=http://vnacialisfbvn.com/#]cialis without a doctor's prescription[/url]
cheapest cialis in uk
online order for cialis
cialis without doctor
cheap indian cialis
[url=http://vnacialisfbvn.com/#]cialis without a doctor[/url]
where can i buy cialis or viagra on line
order viagra cialis
cialis without a doctor prescription
buy cheap cialis usa visa
[url=http://vnacialisfbvn.com/#]cialis without a doctor's prescription[/url]
buy cialis montreal
cialis online sale
cialis without a prescription
the cheapest generic cialis
[url=http://vnacialisfbvn.com/#]cialis without a doctor's prescription[/url]
can cialis pills be split
fake viagra pills
viagra without prescription
buy viagra internet
[url=http://thjsildenafiljkvc.com/#]viagra without an rx[/url]
what do i tell a doctor to get viagra
is there a female viagra pill
viagra without prescription
where can i buy viagra over the counter in south africa
[url=http://thjsildenafiljkvc.com/#]viagra without a doctor prescription[/url]
sildenafil citrate 100mg women
viagra cialis used together
viagra without an rx
psych season 5 viagra falls online
[url=http://thjsildenafiljkvc.com/#]viagra without doctor prescription[/url]
hard get doctor prescribe viagra
generic viagra 100mg sildenafil
viagra without doctor prescription
breaking a viagra pill in half
[url=http://thjsildenafiljkvc.com/#]viagra without a doctor visit[/url]
sildenafil orion 50 mg hinta
online casino 3 reel slots
[url=http://xn--modepntet-02aj.se/?option=com_k2&view=itemlist&task=user&id=419497]99 slots no deposit bonus 2016[/url]
gambling problem toronto
online casino zdarma automaty
buy cialis mexico
cheap cialis
how to order cialis
[url=http://cialisdmngj.com/#]cheap cialis[/url]
cheap cialis generic india
can you buy cialis over the counter in canada
cheap cialis
can cialis pills split
[url=http://cialisdmngj.com/#]cialis prices[/url]
cialis where to buy - malaysia
how to order cialis online no prescription
cialis cost
cialis for sale in canada
[url=http://cialisdmngj.com/#]cialis cost[/url]
cialis online discount
i feel like a viagra pill with a face
viagra without prescription
long does take viagra pills work
[url=http://viagrahukic.com/#]viagra without a doctor prescription[/url]
viagra generic cost
buy levitra cialis
buy cialis online
brand name cialis for sale
[url=http://cialismbvi.com/#]cialis prices[/url]
buy cialis usa
buy cheapest cialis
cialis 20 mg best price
cialis pills in canada
[url=http://cialisemk.com/]cialis tablets[/url]
cialis pills price
buy cialis uk next day delivery
cialis prices
cialis discount price
[url=http://cialismbvi.com/#]buy cialis[/url]
buy cialis super active online
payday loans wichita ks
[url=https://loanstrast.com/]online direct lenders[/url]
compare personal loans
payday loans florida
generic viagra available india
viagra price
viagra delhi price
[url=http://viagramndet.com/#]viagra cost[/url]
viagra cheap usa
viagra sales country
best price for viagra
pillola simile viagra
[url=http://viagramhbfe.com/#]viagra prices[/url]
viagra da 100mg prezzo
payday cash
[url=https://loanstrast.com/]fast loans for bad credit[/url]
cash to go
weekend payday loans
payday loans online
[url=https://loanstrast.com/]payday loans online[/url]
payday loans online
payday loans no credit check
can you buy levitra over the counter
levitra generic
buy generic levitra uk
[url=http://levitraklnbi.com/#]9 levitra at walmart[/url]
generic levitra cheapest prices
levitra buy singapore
9 levitra at walmart
cheap levitra line
[url=http://levitraklnbi.com/#]levitra generic[/url]
cheap levitra india
do you need a prescription to buy levitra
levitra rezeptfrei deutschland
buy levitra in canada
[url=http://levitraklnbi.com/#]levitra generic[/url]
levitra for cheap
buy cialis online with prescription
cialis without a prescription
buy cialis amazon
[url=http://cialisfbvne.com/#]cialis without prescription[/url]
cialis thailand buy
many mg viagra use
viagra without prescription
generic viagra online from canada
[url=http://viagramnkjm.com/#]viagra without a doctor’s prescription[/url]
how to get viagra in ireland
[url=http://lanatrade.eu/]http://lanatrade.eu/[/url] HatSepeta, Asus ROG STRIX GL753VD-GC043T
online vegas slot machine
online casinos
which online casino accept paypal
[url=http://online-casino.party/#]casino real money[/url]
double deck blackjack
online payday loans
[url=https://smajloans.com/]cash loans[/url]
cash advance
payday loans
[url=https://loanstrast.com/]payday advance[/url]
online payday loans
payday loans online
[url=https://loansfast.us.com/]cash loans[/url]
payday loans online
payday loans
casino video
casino online
making money playing slot machines
[url=http://online-casino.party/#]casino online[/url]
play online casino games no download
pokies 888
casino online
100 casino online rating top
[url=http://online-casino.party/#]casino online[/url]
keno online real money
dice games online craps
online casinos
which online casino
[url=http://online-casino.party/#]casino online[/url]
online casino and mac and slot
top 20 online casinos uk
online casinos
rushmore casinos
[url=http://online-casino.party/#]casino[/url]
slots that accept paypal
[url=http://nickelr.us/]http://nickelr.us/[/url] nuffewsInjemn, Nike Herren Free Run 2017 Shield Laufschuhe
price difference between viagra and cialis
viagra without a doctor’s prescription
how can you buy real viagra online in usa
[url=http://viagrajnmeo.com/#]viagra without a prescription[/url]
best prices on viagra and cialis
payday loans no credit check
[url=https://smajloans.com/]payday loans online[/url]
pay day loan
cash loans
[url=https://loanstrast.com/]cash advance loans[/url]
payday loan online
online loans
[url=https://loansfast.us.com/]cash loans[/url]
cash loans
cash advance loans
prices of levitra
ed medications
farmaco generico del viagra
[url=http://pillshnembn.com/#]ed medications[/url]
generic viagra sildenafil
cash advance
[url=https://smajloans.com/]cash loans[/url]
payday loans no credit check
payday loans no credit check
[url=https://loanstrast.com/]online payday loans[/url]
payday loans
pay day loans
[url=https://loansfast.us.com/]payday loans[/url]
payday loan online
payday loans
[url=http://larbo.us/]http://larbo.us/[/url] nuffewsInjemn, How to buy Ambien online?
cheap viagra with prescription
cheap viagra
is there generic for viagra
[url=http://viagrakbg.com/#]buy viagra online[/url]
cheap viagra no rx
where to buy viagra online yahoo
viagra prices
sildenafil 50 mg 4x4
[url=http://viagrakbg.com/#]cheap viagra[/url]
viagra together cialis
safest online viagra
buy viagra
where to buy viagra in kenya
[url=http://viagrakbg.com/#]cheap viagra[/url]
buy viagra tesco pharmacy
can i take 25 mg of viagra
viagra pills
how much mg of viagra
[url=http://viagrakbg.com/#]buy viagra online[/url]
how easy is it to get viagra on prescription
real money casino
[url=http://real777money.com/]free slot games[/url]
slot machines
casino game
payday loans today
payday loans no credit check
short term small loans
[url=http://paydaymnku.com/]payday loans for bad credit[/url]
need loan fast
safest website buy viagra
viagra
buy viagra high street
[url=http://hqviagrajdr.com/]viagra for sale[/url]
how to get viagra without seeing doctor
viagra buy tesco
viagra prices
how to get viagra for women
[url=http://viagrangk.com/#]how much viagra does cost[/url]
propecia and viagra together
buy viagra perth
how much viagra does cost
buying viagra in asia
[url=http://viagrangk.com/#]how much viagra does cost[/url]
buy viagra online legal
taking viagra and flomax together
viagra prices
does sildenafil become generic
[url=http://viagrangk.com/#]best price for viagra[/url]
viagra online bestellen ohne rezept
northwestpharmacy
canadian pharmacies online
cialis canada
[url=http://canadaunmfgb.com/#]canadian pharmacies shipping to usa[/url]
online canadian pharmacy
pay day loans
[url=https://smajloans.com/]pay day loans[/url]
cash advance loans
cash loans
payday loans online
[url=https://smajloans.com/]cash loans[/url]
online loans
online payday loans
looking for cheap viagra
viagra no prescription
order viagra from usa
[url=http://bfviagrajlu.com/#]viagra without a doctor prescription[/url]
cheap viagra alternative
buy american viagra
viagra no script
how can i get some viagra
[url=http://bfviagrajlu.com/#]viagra no script[/url]
buying viagra in new zealand
sildenafil medana tabletki cena
viagra ohne rezept aus deutschland
cheap legal viagra
[url=http://bfviagrajlu.com/#]viagra no prescription[/url]
buy viagra 50mg uk
buying viagra in dominican republic
viagra without a doctor prescription
buy viagra orlando
[url=http://thjsildenafiljkvc.com/#]viagra without a doctor prescription[/url]
used generic viagra
viagra no prescription
sildenafil citrate generic australia
[url=http://bfviagrajlu.com/#]viagra no script[/url]
different types of viagra pills
forum viagra where to buy
viagra without a doctor prescription
viagra 25mg 50mg ou 100mg
[url=http://thjsildenafiljkvc.com/#]viagra without a doctor prescription[/url]
can i buy viagra from tesco pharmacy
viagra no prescription
generic viagra and alcohol
[url=http://bfviagrajlu.com/#]viagra no prescription[/url]
buy viagra online uk
can you buy viagra over the counter in bangkok
viagra without a doctor prescription
when will viagra be a generic
[url=http://thjsildenafiljkvc.com/#]viagra without prescription[/url]
buy viagra uk yahoo
viagra ohne rezept aus deutschland
sex offenders to get free viagra
[url=http://bfviagrajlu.com/#]viagra no prescription[/url]
difficult get prescription viagra
[url=http://sporteshop.eu/]http://sporteshop.eu/[/url] nuffewsInjemn, Puma Herren Carson 2 Knit Outdoor Fitnessschuhe
information viagra pills
viagra without a doctor prescription
chrono cross get viagra
[url=http://thjsildenafiljkvc.com/#]viagra without a doctor prescription[/url]
can you get high viagra
viagra without a doctor prescription
is there really generic viagra
[url=http://bfviagrajlu.com/#]viagra without a doctor prescription[/url]
viagra generico como usar
[url=http://handtasche.xyz/]http://handtasche.xyz/[/url] irrabyDimePeally , VADOOLL Damen Schultertasche Canvas Totes Hobo Bag mit einfachem
buy viagra online yahoo answers
viagra without a doctor prescription
there cheaper alternative viagra
[url=http://thjsildenafiljkvc.com/#]viagra without prescription[/url]
viagra online free trial
viagra no prescription
viagra for sale in boots
[url=http://bfviagrajlu.com/#]viagra no prescription[/url]
buy generic viagra from canada
payday loans no credit check
[url=https://smajloans.com/]payday loans online[/url]
payday loans
payday loans online
buy viagra bali
viagra cheap
generic viagra shipped from us
[url=http://sildenafilmkfbv.com/#]viagra prices[/url]
walgreens pharmacy price of viagra
[url=http://wintermode.xyz/]http://wintermode.xyz/[/url] damen wintermode irrabyDimePeally , Tamaris Damen 26239 Combat Boots
where can i buy viagra in melbourne
viagra prices
receita medica comprar viagra
[url=http://sildenafilmkfbv.com/#]viagra cost[/url]
viagra cheap online no prescription
payday loans no credit
[url=http://paydaynock.com/]payday loans no credit[/url]
payday loans no credit check
payday loans online no credit check
online casino games
[url=http://casinoline17.com/]casino games[/url]
online casino real money
online casino
Cialis Effet Temps [url=http://costofcial.com]generic cialis[/url] Propecia Generico In Farmacia Viagra Belgique Cialis Tarif Levitra cialis Achat Cialis A Prix Competitifs Buying Direct Acticin Ups In Internet Shop Buy No Prescription Generic Flagyl In Prague Order Zithromax Without Prescription Cephalexin For Upper Respiratory Infection http://costofcial.com - cialis Viagra Marche Pas Aldara
cialis flavored bon marche
[url=http://canadiancialisaus.com/]canadian cialis[/url]
buy cialisordering cheap cialis
[url=http://cialisubz.com/]cialis canada[/url]
cialiswhy does viagra cost so much
[url=http://viagrahsk.com/]generic viagra online[/url]
viagra online
small business loan bad credit
best payday loans
cash money payday loan
get cash now
buy levitra generic
levitra 20 mg
cheap-levitra.com
[url=http://levitradbws.com/#]vardenafil 20mg[/url]
levitra buy online
vardenafil 20mg
buy real levitra
[url=http://vardenafilghns.com/#]vardenafil 20mg[/url]
where to buy generic levitra online
cialis levitra comprar
[url=http://cialisnji.com/]generic cialis[/url]
generic cialisbest payday loans no credit check no brokers
[url=http://soloadvance.com/]payday loans[/url]
payday loans online
generic cialis buy
buy generic cialis online
order cialis us
[url=http://cialisyrudgj.com/#]generic cialis[/url]
ambien cialis eteamz.active.com generic link order
cheap cialis
buy levitra cialis viagra
[url=http://cialisuitykh.com/#]cialis price[/url]
buy cheap cialis line
can buy viagra paypal
viagra online
viagra and arginine together
[url=http://viagratutrjdsd.com/#]viagra online pharmacy[/url]
can you get viagra on the medical card
viagra online pharmacy
viagra generico vendita
[url=http://viagraeyefbdj.com/#]viagra online[/url]
viagra buy
[url=http://buychcialisonline.com/]buy cialis online cheap[/url]
canada cialis online
http://buychcialisonline.com
norvasc and cialis generic
buy generic cialis online
order viagra for women
buy viagra
buying viagra line uk
[url=http://viagratutrjdsd.com/#]viagra online[/url]
i want to order viagra
cheap viagra online
viagra online buy india
[url=http://viagraeyefbdj.com/#]viagra online pharmacy[/url]
viagra cialis levitra buy
buy cheap viagra online canada
viagra online pharmacy
viagra cialis cheap online
[url=http://viagratutrjdsd.com/#]buy viagra online pharmacy[/url]
generic viagra do they work
cheap viagra online
generic viagra mycoxafloppin
[url=http://viagraeyefbdj.com/#]viagra online[/url]
boots viagra price
differenza tra viagra generico e originale
buy viagra online pharmacy
sildenafil citrate order online
[url=http://viagratutrjdsd.com/#]viagra online[/url]
taking levitra viagra together
online viagra
sildenafil 50 mg calox
[url=http://viagraeyefbdj.com/#]online viagra[/url]
buy viagra zimbabwe
[url=http://viagranrxmedonline.com/]viagra generic[/url]
how much is viagra at walmart
http://viagranrxmedonline.com
viagra 6 free samples
viagra generic
order cialis no prescription online
cialis price
cialis professional buy
[url=http://cialisietwdffjj.com/#]best price cialis[/url]
buy cialis in italy
cialis cheap
order cialis no prescription
[url=http://cialisytigjtuj.com/#]cialis cheap[/url]
viagra cialis online order
buy cialis from usa
best price cialis
best site to order cialis
[url=http://cialisietwdffjj.com/#]cialis best price[/url]
cheap 2.5 mg cialis
cialis price
cheap cialis pills
[url=http://cialisytigjtuj.com/#]cialis prices[/url]
cialis for sale in canada
[url=http://viagranrxmedonline.com/]viagra online[/url]
viagra cost per pill 2015
http://viagranrxmedonline.com
viagra migraine
buy viagra online
[url=http://buychcialisonline.com/]buy generic cialis[/url]
generic cialis tadalafil 20mg
http://buychcialisonline.com
cialis website
cheap cialis online
discount canadian cialis
cialis cost
ac uk buy cialis
[url=http://cialisietwdffjj.com/#]best price cialis[/url]
cialis buy canada
cialis price
cialis blue pills
[url=http://cialisytigjtuj.com/#]cialis prices[/url]
where is the best place to buy generic cialis
http://cialisbrx.com
australia buy cheap cialis online
[url=http://cialisbrx.com/]buy generic cialis online[/url]
cialis tablets 5mg
buy cialis online
[url=http://nrxcialismeds.com/]cheap cialis online[/url]
cialis dosage 20mg
http://nrxcialismeds.com
next day brand cialis only online
buy cheap cialis online
online casino
[url=http://bom777casino.com/]п»їcasino online[/url]
casino games
п»їcasino online
cialis and viagra for sale
best price cialis
cialis pills expire
[url=http://cialisietwdffjj.com/#]cialis cost[/url]
cialis c20 pills
cialis cheap
cialis uk sale
[url=http://cialisytigjtuj.com/#]cialis prices[/url]
safe place order cialis
buy cialis usa
cialis cost
order cialis online australia
[url=http://cialisietwdffjj.com/#]cialis best price[/url]
cialis coupon discounts
cialis price
buy cialis cheap prices fast delivery
[url=http://cialisytigjtuj.com/#]cheap cialis[/url]
where can i buy cialis online
http://cialisbrx.com
chemical name cialis pills
[url=http://cialisbrx.com/]cialis online[/url]
women cialis generic
buy generic cialis online
can u take half of a viagra pill
viagra without prescription
viagra where to buy in canada
[url=http://viagrarutjdfk.com/#]viagra without a doctor prescription[/url]
buy viagra online uk no prescription
cheap viagra
viagra 25mg vs 50 mg
[url=http://viagrajretnfc.com/#]viagra cost[/url]
buy viagra online in united states
[url=http://genviagramrxonline.com/]viagra online[/url]
natural alternatives to viagra
http://genviagramrxonline.com
viagra e simili
viagra generic
[url=http://genviagramrxonline.com/]buy viagra online[/url]
viagra online canadian pharmacy
http://genviagramrxonline.com
viagra 100mg price costco
buy generic viagra
[url=http://cialisusmedsonline.com/]generic cialis online[/url]
buy brand cialis online pharmacy
http://cialisusmedsonline.com
correct dosage of cialis 20mg
buy cialis online
online casino
[url=http://bom777casino.com/]real money casino[/url]
free casino games
free casino games
[url=http://cialisgenbuynrx.com/]cialis online[/url]
buy daily cialis
http://cialisgenbuynrx.com
herbal viagra for women cialis generic
cheap cialis online
[url=http://cialisgenbuynrx.com/]cheap cialis online[/url]
alcohol cialis generic
http://cialisgenbuynrx.com
order cialis online no prescription
buy generic cialis
[url=http://cialiscbuynrx.com/]cialis online[/url]
daily side effects cialis tablets
http://cialiscbuynrx.com
sell cialis generic
buy cialis
generico do viagra na ultrafarma
viagra without a doctor prescription online
viagra online from boots
[url=http://viagrarutjdfk.com/#]viagra without a doctor prescription[/url]
safe place to buy viagra uk
viagra cost
where to get viagra in philippines
[url=http://viagrajretnfc.com/#]cheap viagra[/url]
generic viagra united pharmacy
us online casinos mac
casino
play blackjack online for money paypal
[url=http://online-casino.party/#]casino[/url]
sa online casinos using ukash
online casino
[url=http://bom777casino.com/]free casino games[/url]
real money casino
free casino games
[url=http://cialisgenbuynrx.com/]buy cialis online[/url]
generic 10 mg cialis 20mg
http://cialisgenbuynrx.com
cialis 20mg pills
cheap cialis
[url=http://buygencialismedmrx.com/]generic cialis online[/url]
cialis 5mg price prescription
http://buygencialismedmrx.com
best place to buy cialis cialis
generic cialis online
free casino games
[url=http://bom777casino.com/]online casino[/url]
casino games
casino games
[url=http://buygencialismedmrx.com/]buy generic cialis online[/url]
generic cialis soft tab
http://buygencialismedmrx.com
cialis for order generic
generic cialis online
[url=http://buygencialismedmrx.com/]buy cialis generic[/url]
cialis canadian pharmacy cheap
http://buygencialismedmrx.com
buy genuine cialis 20mg
buy generic cialis
we like it purchase cialis
[url=http://supercialisheree.com/]cialis cheap[/url]
cialis super active
safe cialis online
[url=http://buygencialismedmrx.com/]buy generic cialis online[/url]
cialis brand online
http://buygencialismedmrx.com
buy cialis online without a prescription
cialis coupon
[url=http://buygencialismedmrx.com/]buy generic cialis online[/url]
split cialis pills impotence
http://buygencialismedmrx.com
buy cialis online without a health
buy cialis generic
[url=http://cialischbuynrx.com/]buy cialis online[/url]
how long does cialis 20mg
http://cialischbuynrx.com
free cialis pills
cheap cialis
online casino
[url=http://bom777casino.com/]real money casino[/url]
casino online
casino games
[url=http://buygencialismedmrx.com/]cialis generic[/url]
buy generic cialis university of kentucky
http://buygencialismedmrx.com
sell cialis generic
cheap generic cialis
[url=http://cialischbuynrx.com/]cheap cialis online[/url]
buy generic cialis online sildenafil citrate
http://cialischbuynrx.com
buy generic cialis maintain an erection
cheap cialis online
[url=http://cialismnrx.com/]buy generic cialis[/url]
search cialis generic
http://cialismnrx.com
sample of cialis pharmacy
online cialis
[url=http://cialismnrx.com/]cialis[/url]
buy cialis generic
http://cialismnrx.com
buy cialis next day delivery
cheap cialis online
[url=http://cialismnrx.com/]buy cheap cialis online[/url]
pill cialis generic
http://cialismnrx.com
how much is viagra at walmart cialis generic
buy cialis generic
best payday loan sites
payday advance online
military loans
3 month payday loans
[url=http://cialismnrx.com/]buy generic cialis[/url]
viagra fact sheet cialis generic
http://cialismnrx.com
generic vs brand name cialis
generic cialis
[url=http://cialisknfrx.com/]buy cialis[/url]
cialis pills free trial
http://cialisknfrx.com
buy soft cialis cialis
cheap cialis
http://x1cashadvanceonlines.com
long term loans for bad credit no guarantor
[url=http://x1cashadvanceonlines.com]cash advance[/url]
payday loans direct lender only
cash advance
[url=http://cialisknfrx.com/]buy cialis[/url]
cialis pills online
http://cialisknfrx.com
cialis 5mg
cialis cost
super cialis order online
[url=http://cialisjqp.com/]cialis cheap[/url]
generic cialis onlineajanta generic cialis
[url=http://cialisnji.com/]cialis online[/url]
cialis onlinecash loans with instant approval
[url=http://soloadvance.com/] payday express[/url]
loans for bad credit
http://x1cashadvanceonlines.com
cash advance payday loan
[url=http://x1cashadvanceonlines.com]cash advance online[/url]
payday loans new lenders
cash advance loans
[url=http://buycialismedmrx.com/]generic cialis online[/url]
spam viagra cialis generic levitra
http://buycialismedmrx.com
brand cialis online pharmacy
generic cialis online
[url=http://viagramrxbuymed.com/]online viagra[/url]
viagra before and after video
http://viagramrxbuymed.com
is there a generic viagra
viagra online
[url=http://bstcialisusa.com/]cialis online[/url]
cialis canada online pharmacy
http://bstcialisusa.com
cialis online p harmacy canada
generic cialis
[url=http://cialisrxmonline.com/]buy generic cialis online[/url]
cialis discount generic
http://cialisrxmonline.com
buy generic cialis online sildenafil citrate buy
buy cialis online
[url=http://bstcialisusa.com/]buy cialis online[/url]
buy generic cialis generic cialis
http://bstcialisusa.com
lasix and viagra cialis generic
buy cheap cialis online
[url=http://viagramrxgeneric.com/]generic viagra online[/url]
viagra online no prior prescription
http://viagramrxgeneric.com
cialis vs viagra vs levitra
viagra cheap
[url=http://genviagramdmrx.com/]cheap viagra[/url]
cocaine and viagra
http://genviagramdmrx.com
girl viagra
cheap viagra online
[url=http://cialismdmarx.com/]cheap generic cialis[/url]
prices cialis
http://cialismdmarx.com
buy generic cialis canada
cialis
[url=http://buyviagramdmarx.com/]cheap viagra online[/url]
viagra discount card
http://buyviagramdmarx.com
viagra definition
cheap viagra online
slots for free
[url=http://casinobablogames.com/]free casino slots[/url]
online casino games
free slots casino games
[url=http://buyviagramdmarx.com/]buy viagra[/url]
how can i get viagra
http://buyviagramdmarx.com
viagra commercial girl
buy viagra online
viagra il prezzo migliore uk
[url=http://viagraonlas.com/]generic viagra online[/url]
generic viagra online
coupons viagra online
autocad 2012 sp1 download
autocad viewer
autocad architecture 2017 student version
[url=http://autocadtymafq.com/#]autocad download[/url]
autocad 2014 academic
autocad 2018
autocad doors and windows download
[url=http://autocadbnaqk.com/#]autodesk[/url]
autocad 2012 product serial number
[url=http://viagramedsonlinerx.com/]cheap viagra online[/url]
viagra generic date
http://viagramedsonlinerx.com
viagra alternative pills
buy viagra online
autodesk student autocad 2015
autocad viewer
product license activation options autocad 2017
[url=http://autocadbmjes.com/#]autocad viewer[/url]
autocad 2017 commercial new slm price
cad
autocad electrical downloads
[url=http://autocadtfesvb.com/#]autodesk autocad[/url]
autocad lt download 2017
[url=http://cialismedrxonlinegen.com/]generic cialis online[/url]
viagra onsale cialis pills
http://cialismedrxonlinegen.com
generic cialis vs cialis order
generic cialis
[url=http://buyviagraonlinegenrx.com/]where to buy viagra[/url]
viagra online without prescription
http://buyviagraonlinegenrx.com
viagra alcohol
cheap viagra
[url=http://cialismedrxonlinegen.com/]buy cialis online[/url]
generic cialis from india
http://cialismedrxonlinegen.com
viagra pills paypal cialis generic
cheap cialis online
[url=http://cialismedrxonlinegen.com/]generic cialis[/url]
online cialis scam
http://cialismedrxonlinegen.com
viagra and weight lifting cialis generic
online cialis
800 mg viagra
viagra without script
donde puedo comprar viagra sin receta en buenos aires
[url=http://viagrayirib.com/#]viagra without a doctor prescription[/url]
veilig online viagra
viagra
viagra no prescription online canada
[url=http://viagrahkfy.com/#]viagra coupon[/url]
comprar viagra capital federal
[url=http://gencialismedsmrrxonline.com/]generic cialis online[/url]
nizoral alternative cialis 20mg
http://gencialismedsmrrxonline.com
cialis for sale online
cheap generic cialis
[url=http://buycheapcialismrxonline.com/]buy cheap cialis online[/url]
australia buy ch eap cialis online
http://buycheapcialismrxonline.com
price of cialis tablets
cheap cialis online
triple diamond slots 5x
[url=http://bablcasinogames.com/]free casino games vegas world[/url]
top online casino
casino arizona
[url=http://buychcialismrxonline.com/]generic cialis[/url]
pill splitting cialis 20mg buy
http://buychcialismrxonline.com
buy generic cialis uk
cheap cialis
viagra generika kaufen absolut diskret
viagra without a doctor prescription
cuanto sale un viagra
[url=http://viagrawyrfhdj.com/#]viagra without prescription[/url]
cheap viagra without prescriptions
viagra prices
where to buy sildenafil
[url=http://viagrartuudhf.com/#]viagra prices[/url]
viagra preis 100mg
generic viagra uk sales
viagra without prescription
viagra 50 mg efectos
[url=http://viagrawyrfhdj.com/#]viagra without prescription[/url]
viagra mit rezept online kaufen
cheap viagra
cialis 20 mg ou viagra 100mg
[url=http://viagrartuudhf.com/#]cheap viagra[/url]
best pharmacy to buy viagra
blue pill - generic viagra
viagra without doctor
how long does it take to get an erection with viagra
[url=http://viagrayutkh.com/#]viagra without prescription[/url]
viagra online pills
viagra prices
existe la viagra generica
[url=http://viagratyrif.com/#]viagra online[/url]
viagra 25 50 oder 100 mg
viagra online cost
viagra without prescription
best place to get generic viagra
[url=http://viagrayutkh.com/#]viagra without prescription[/url]
150 mg viagra too much
viagra prices
can you take half a 100 mg viagra
[url=http://viagratyrif.com/#]cheap viagra[/url]
many viagra pills should take
is there generic viagra available
viagra without doctor
age to buy viagra
[url=http://viagrayutkh.com/#]viagra prices[/url]
where do i buy viagra in australia
buy viagra
overnight shipping generic viagra
[url=http://viagratyrif.com/#]viagra online[/url]
when will viagra be a generic drug
[url=http://medicabc.us/]http://medicabc.us/[/url] PlerlyMoldNewweari , Buy generic ambien 10mg 30 day ab
viagra tabletas 25 mg
viagra without doctor
viagra billig online
[url=http://viagrayitykckg.com/#]viagra without prescription[/url]
where to get viagra over the counter
sildenafil citrate 100 mg pills
legal buy viagra online
[url=http://sildenafiletudgj.com/#]sildenafil citrate tablets[/url]
sales@cheap-generic-viagra
[url=http://medicbox.us/]http://medicbox.us/[/url] PlerlyMoldNewweari , [url=http://medicbox.us/]http://medicbox.us/[/url] PlerlyMoldNewweari
[url=http://medabc.us/]http://medabc.us/[/url] PlerlyMoldNewweari , Santamedical PM-510 Tens Unit Electronic Pulse Massager
[url=http://dbaby.eu/]http://dbaby.eu/[/url] PlerlyMoldNewweari , [url=http://dbaby.eu/]http://dbaby.eu/[/url] PlerlyMoldNewweari
casino online
[url=http://casinoveganonline.com/]vegas casino games[/url]
aol games free casino
new usa online casinos 2017
casino online for fun
[url=http://casinoveganonline.com/]casino slots[/url]
pogo casino slots
play casino games online
diet pills that work
[url=http://regimenforfeit.com/]best diet pills that work[/url]
diet supplements that work
weight loss pills for women
[url=http://clomidxx.com/]http://clomidxx.com/[/url] PlerlyMoldNewweari , Complex Sleep Apnea
buy viagra generics nl
viagra without doctor
viagra 50mg tempo efeito
[url=http://viagrahlsacft.com/#]viagra without a doctor's prescription[/url]
buy real viagra online
viagra generic
generic viagra europe
[url=http://viagravbndcvef.com/#]generic viagra[/url]
buy viagra online switzerland
weight loss tablets
[url=http://regimenforfeit.com/]best over the counter diet pills[/url]
best weight loss products
best weight loss products
buy generic cialis no prescription
cialis cialis prices
safe place order cialis online
[url=http://cialiskkg.com/#]cialis generico online[/url]
buy cialis cheap online
generic cialis at walmart
buy real cialis uk
[url=http://cialisdcfev.com/#]generic cialis tadalafil[/url]
cialis buy india
cialis sale uk
cialis generico online
cheapest cialis price
[url=http://cialiskkg.com/#]cialis online[/url]
discount name brand cialis
generic cialis at walmart
cialis description of pills
[url=http://cialisdcfev.com/#]cialis generic[/url]
cheap cialis melbourne
[url=http://nutritioninpill.com/]http://nutritioninpill.com/[/url] PlerlyMoldNewweari , A Guide To Testosterone Cream
cialis e cardioaspirina|cialis 10mg preise|only now cialis online buy|dove comprare cialis a roma|comprar cialis en la red|cialis 20 mg at walmart|achat cialis 10 mg|cialis per paypa|apakah cialis 10mg cukup ampuh|ccialis|cialis generici india|achat cialis au canada|cialis 5 mg discount coupon|cialis und co erfahrungen|cialis buy no prescriptions|generic cialis lilly|cialis recreatif|manfaat cialis 80mg|cheap cialis 50 mg|good choice buy canada cialis|cialis para barato|quanto costa il cialis da 10 m|cialis 5mg online non generic|cialis 10mg ligne|online apotheke cialis levitra|cialis for sale in spain|just try rx cialis low price|cialis canada for sale|ebay cialis generico|cialis de 20 m|pharmacy generic cialis eu|what is maximum dosage cialis|cialis vendors|visit web site no rx cialis|discount cialis free|order cialis online toronto|cialis professional vs ciali|buy cialis professional boots|cialis naturale erboristeria|cialis tadalafil 20mg preis|compare prices on cialis pills|cheap generic cialis 60 mg|comprar cialis bueno|cialis online brasil|purchase cialis on line|online pharmacy cialis|cialis cheapest online|billige cialis i europa|purchasing cialis from canada|buy cialis johannesburg|cialis 0 5|cialis generico peru|cialis tarif pharmaci|wow fast delivery cialis|discount 800 mg cialis|40mg cialis cheap|cialis precio de inglaterra|we choice use cialis|uk profesional cialis barato|brand name cialis in australia|cialis en lnea aus|cialis 10 mg vendita online|cialis jelly delivery uk|ebay levitra cialis|cheap 5 mg cialis prices|cialis daily uk users group|cialis sales online canada|pharmacie canada quebec cialis|cialis super active mg usa|30 5mg tablets cialis price|cheap cialis in the usa|cialis en belgique|cialis 10mg vente en ligne|insurance cialis daily bhp|cialis on line canada|what is a cialis pill used for|cialis without precription|only for you rx generic cialis|campione libero cialis uk|visit our site cialis pharmacy|buy australia cialis|cialis e anemia|cialis low cost us|cialis generico consegna rapid|generic cialis jelly|cialis baratos la india|mg cialis effects 20|cialis le ru le meilleur prix|order cialis melbourne|cialis canada buy|cialis ou levitra|free 30 day cialis|cialis pill price per pill|comprar cialis de 5 mg|levitra generico di cialis|cialis langzeittherapie|levitra o cialis 10 mg|cialis in australia for sale|one day cialis|cialis da banco|cialis10mg bestellen|is 30mg of cialis too much|cialis 20mg cpr4|use of cialis for bph|cialis 5mg terapia|cialis dosage recreational use|cialis generico de confianza|just try cialis|cialis in francia|costo cialis one day|cialis 10 mg lilly|cialis moins cher en france|cialis achat serieux|wow look it online us cialis|cialis 20 mg canada|cialis 5mg preis apotheke|try it cialis attorneys|cialis wirkung dosis|where to cialis in malaysia|cialis generic 10 mg|daily cialis dosage|click now where to find cialis|for sale cialis e20 pills|cialis for sale in california|billig cialis kaufen|venta cialis serena|ricetta di cialis|cialis pain and|skip to brand cialis for sale|we choice wholesale cialis|i use it cialis online fda|wwwcialiscom|cialis erection pills|cialis para diabetico|buy cialis or kumora|cialis 5mg ohne rezept|order cialis online legally|comprar cialis bogot|buy cialis egypt|best pharmacy prices cialis|buy cialis online us|try it cialis sales uk|compra de cialis legtimo|cialis 10 mg mejor precio|propecia cialis ou viagr|cialis nederland|does cialis cause muscle loss|we like it fda approved cialis|cialis 20 mg costco|cialis marcado uk mejor precio|look here get cialis fast|cialis giornaliero 5 mg|cialis apotheke sterreich|how to buy generic cialis soft|cialis|canada generic cialis|cialis sin receta us|cialis 5 mg serve|cialis 5mg brand name|1 generic cialis|cialis tabletas precio|cialis prices|cialis prezzo del prodotto|cialis prescription pills|we like it cialis sale|cialis for sale in nc|cialis indie|cialis levitra paypal|preis cialis tadalafil|where to buy cialis pills|svizzera costo cialis|generico cialis economico|cialis un prezzo basso|cialis compare price|generique cialis pharmacie|cialis purchase 5mg|ordering cialis usa|generic cialis 5mg order|wow look it cialis dose|common uses of cialis|precio cialis 20 mg en farmaci|click now canada cialis|cialis zur tglichen einnahme|coupon cialis 20|cialis 5 mg o 20 mg|should i take 2 20mg cialis|cialis 5mg preise apotheke|offerta cialis generico|where can u buy cialis pills|look there cialis to order|cialis 5 mg walmart|cialis premature for|cialis with dapoxetine|buy cialis buy cialis line|cialis 20 mg compra|just try order no rx cialis|cialis kaufen rechnun|kaufpreisnachlass cialis|cialis per donna|cialis generic cost|po cialis ship box|order cialis 10mg cheap|cialis durata effett|venta de cialis barcelona|cialis pills online canada|vendita cialis 5 mg en ligne|como tomar cialis|order prescription free cialis|cialis 100mg suppliers|cialis rheuma|purchase cheap cialis online|brand name cialis from canada|buy pills dapoxetine cialis us|does cialis work if swallowed|le mieux affaires de cialis|cialis brausetabletten|buy cialis soft c o d|is there generic cialis|cialis soft tabs how to take|how can i buy cialis online|cialis erbe|venta de cialis professional|cialis paiement paypal|the best site cialis purchase|only now find cheapest cialis|farmacia di uk cialis|cialis y dolor de cabeza|cialis soft from usa pharmacy|cialis jappy|cialis sublingual tabs|reasonably priced cialis|el cialis compr barato|generic cialis online|cheapest cialis online sample|just try best price on cialis|donde comprar cialis en manila|achat cialis forum|cialis cost in bangkok|quanto costa cialis farmaci|cialis cost kaiser|wow discount cialis no rx|cialis forum erfahrungen|look there cialis med store|good choice cialis soft tabs|cialis table|daily doses of cialis|donde comprar cialis barat|cialis farmacodinamica|cialis price per tab 20mg|precio cialis uso diario
[url=http://cialisuperuy.com/]cialis super active,cialis online,buy cialis,generic cialis online,generic cialis,cialis cheap,cialis online,buy cialis,cialis,cialis,buy cialis online[/url]
cialis super active,cialis online,buy cialis,generic cialis online,generic cialis,cialis cheap,cialis online,buy cialis,cialis,cialis,buy cialis online
cialis e cardioaspirina|cialis 10mg preise|only now cialis online buy|dove comprare cialis a roma|comprar cialis en la red|cialis 20 mg at walmart|achat cialis 10 mg|cialis per paypa|apakah cialis 10mg cukup ampuh|ccialis|cialis generici india|achat cialis au canada|cialis 5 mg discount coupon|cialis und co erfahrungen|cialis buy no prescriptions|generic cialis lilly|cialis recreatif|manfaat cialis 80mg|cheap cialis 50 mg|good choice buy canada cialis|cialis para barato|quanto costa il cialis da 10 m|cialis 5mg online non generic|cialis 10mg ligne|online apotheke cialis levitra|cialis for sale in spain|just try rx cialis low price|cialis canada for sale|ebay cialis generico|cialis de 20 m|pharmacy generic cialis eu|what is maximum dosage cialis|cialis vendors|visit web site no rx cialis|discount cialis free|order cialis online toronto|cialis professional vs ciali|buy cialis professional boots|cialis naturale erboristeria|cialis tadalafil 20mg preis|compare prices on cialis pills|cheap generic cialis 60 mg|comprar cialis bueno|cialis online brasil|purchase cialis on line|online pharmacy cialis|cialis cheapest online|billige cialis i europa|purchasing cialis from canada|buy cialis johannesburg|cialis 0 5|cialis generico peru|cialis tarif pharmaci|wow fast delivery cialis|discount 800 mg cialis|40mg cialis cheap|cialis precio de inglaterra|we choice use cialis|uk profesional cialis barato|brand name cialis in australia|cialis en lnea aus|cialis 10 mg vendita online|cialis jelly delivery uk|ebay levitra cialis|cheap 5 mg cialis prices|cialis daily uk users group|cialis sales online canada|pharmacie canada quebec cialis|cialis super active mg usa|30 5mg tablets cialis price|cheap cialis in the usa|cialis en belgique|cialis 10mg vente en ligne|insurance cialis daily bhp|cialis on line canada|what is a cialis pill used for|cialis without precription|only for you rx generic cialis|campione libero cialis uk|visit our site cialis pharmacy|buy australia cialis|cialis e anemia|cialis low cost us|cialis generico consegna rapid|generic cialis jelly|cialis baratos la india|mg cialis effects 20|cialis le ru le meilleur prix|order cialis melbourne|cialis canada buy|cialis ou levitra|free 30 day cialis|cialis pill price per pill|comprar cialis de 5 mg|levitra generico di cialis|cialis langzeittherapie|levitra o cialis 10 mg|cialis in australia for sale|one day cialis|cialis da banco|cialis10mg bestellen|is 30mg of cialis too much|cialis 20mg cpr4|use of cialis for bph|cialis 5mg terapia|cialis dosage recreational use|cialis generico de confianza|just try cialis|cialis in francia|costo cialis one day|cialis 10 mg lilly|cialis moins cher en france|cialis achat serieux|wow look it online us cialis|cialis 20 mg canada|cialis 5mg preis apotheke|try it cialis attorneys|cialis wirkung dosis|where to cialis in malaysia|cialis generic 10 mg|daily cialis dosage|click now where to find cialis|for sale cialis e20 pills|cialis for sale in california|billig cialis kaufen|venta cialis serena|ricetta di cialis|cialis pain and|skip to brand cialis for sale|we choice wholesale cialis|i use it cialis online fda|wwwcialiscom|cialis erection pills|cialis para diabetico|buy cialis or kumora|cialis 5mg ohne rezept|order cialis online legally|comprar cialis bogot|buy cialis egypt|best pharmacy prices cialis|buy cialis online us|try it cialis sales uk|compra de cialis legtimo|cialis 10 mg mejor precio|propecia cialis ou viagr|cialis nederland|does cialis cause muscle loss|we like it fda approved cialis|cialis 20 mg costco|cialis marcado uk mejor precio|look here get cialis fast|cialis giornaliero 5 mg|cialis apotheke sterreich|how to buy generic cialis soft|cialis|canada generic cialis|cialis sin receta us|cialis 5 mg serve|cialis 5mg brand name|1 generic cialis|cialis tabletas precio|cialis prices|cialis prezzo del prodotto|cialis prescription pills|we like it cialis sale|cialis for sale in nc|cialis indie|cialis levitra paypal|preis cialis tadalafil|where to buy cialis pills|svizzera costo cialis|generico cialis economico|cialis un prezzo basso|cialis compare price|generique cialis pharmacie|cialis purchase 5mg|ordering cialis usa|generic cialis 5mg order|wow look it cialis dose|common uses of cialis|precio cialis 20 mg en farmaci|click now canada cialis|cialis zur tglichen einnahme|coupon cialis 20|cialis 5 mg o 20 mg|should i take 2 20mg cialis|cialis 5mg preise apotheke|offerta cialis generico|where can u buy cialis pills|look there cialis to order|cialis 5 mg walmart|cialis premature for|cialis with dapoxetine|buy cialis buy cialis line|cialis 20 mg compra|just try order no rx cialis|cialis kaufen rechnun|kaufpreisnachlass cialis|cialis per donna|cialis generic cost|po cialis ship box|order cialis 10mg cheap|cialis durata effett|venta de cialis barcelona|cialis pills online canada|vendita cialis 5 mg en ligne|como tomar cialis|order prescription free cialis|cialis 100mg suppliers|cialis rheuma|purchase cheap cialis online|brand name cialis from canada|buy pills dapoxetine cialis us|does cialis work if swallowed|le mieux affaires de cialis|cialis brausetabletten|buy cialis soft c o d|is there generic cialis|cialis soft tabs how to take|how can i buy cialis online|cialis erbe|venta de cialis professional|cialis paiement paypal|the best site cialis purchase|only now find cheapest cialis|farmacia di uk cialis|cialis y dolor de cabeza|cialis soft from usa pharmacy|cialis jappy|cialis sublingual tabs|reasonably priced cialis|el cialis compr barato|generic cialis online|cheapest cialis online sample|just try best price on cialis|donde comprar cialis en manila|achat cialis forum|cialis cost in bangkok|quanto costa cialis farmaci|cialis cost kaiser|wow discount cialis no rx|cialis forum erfahrungen|look there cialis med store|good choice cialis soft tabs|cialis table|daily doses of cialis|donde comprar cialis barat|cialis farmacodinamica|cialis price per tab 20mg|precio cialis uso diario
[url=http://www.healtek.us/]http://www.healtek.us/[/url] PlerlyMoldNewweari , Acid Reflux Heartburn
[url=http://medicplus.us/]http://medicplus.us/[/url] PlerlyMoldNewweari , Medicated Weight-loss And Improving Health
viagra canada
online pharmacy
canadian pharmacy cialis
[url=http://canadianymmgfd.com/#]canada pharmacy[/url]
canadian viagra
legitimate canadian mail order pharmacies
online pharmacies in usa
[url=http://pharmacyryutjfg.com/#]canadian online pharmacies[/url]
canadian pharmacy cialis
viagra con receta espana|viagra professional australia|viagra online pharmacy india|buy viagra 50 mg online|ik wil viagra bestellen|vente viagra kamagr|compra viagra online espana|meilleur site achat viagra|the best site viagra sales|femminile viagra|viagra cost without insurance|tabs viagra 50mg 100mg|cialis viagra best price|are generic viagra any good|a free sample of viagra|buy cheapest generic viagra|viagra to order|click now viagra 25 mg order|viagra kautabletten|viagra usa kauf|australia viagra barata|viagra 60mg|viagra pfizer teva|buy pills like viagra|cialis viagra onlin|most recognized brand viagra|viagra im internet gefahrlich|viagra dnemark rezeptfrei|the best female viagra|viagra generische cialis|cheap viagra fast|viagra soft tabs dosage|pl viagra|frauen viagra verkauf online|usefull link viagra online buy|viagra 25 effett|assunzione viagra cialis|pharmatheke viagra|viagra 100mg long does last|vente viagra naturel|click now online viagra in u s|viagra comment fair|discount viagra rx|is generic viagra legal|viagra per pill cost uk|only here viagra buy uk|viagra online discreet|we use it buy viagra us|viagra edrugstore|mytabs viagra|prix officiel viagra belgique|viagra victoria australia|safest cheapest viagra|viagra 100 street price|order viagra soft|shoud you buy viagra|viagra vs cialis forum|venta de viagra ny|can you drink alcohol viagra|delivery uk fast viagra|donde comprar viagra en la web|viagra y derivado|viagra india|order viagra over phone|follow link viagra pill|womens viagra forum|cheap viagra ontario|buy viagra online uk paypal|cost of viagra jelly|viagra generic soft tabs 50mg|buy viagra here in the uk|viagra and levitra dosage|use of viagra jelly|is maximum dosage for viagra|generic versions of viagra|viagra en pharmacie tunisie|pfizer viagra 100mg women|mejor viagra o cialis|buy viagra gold coast|viagra vendita offerta|50 mg viagra not working|tesco pharmacy online viagra|compare viagra prices|buy pharmacy generic viagra|pfizer viagra achat canada|viagra abu dhabi|viagra rezept arzt|stamina rx vs viagra|buy viagra t shirt|pfizer viagra prezzo|buy female viagra with e check|viagra levitra and tadalafil|click now viagra mail order|cheapest viagracouk|acheter viagra qualit|viagra ecstasy|viagra effet contraire|viagra en oferta|viagra in taiwan|best viagra jelly prices|viagra real mail|viagra sperm count|viagra ejaculation precoce|prix du viagra pfizer|buy viagra onli ne|viagra avec cialis|is viagra bad for the heart|when do take a viagra pill|buy viagra in malaysi|brand viagra over the net|generic viagra illegal|viagra teenage use|buy viagra in nigeria|viagra cialis experiencias|viagra online a href|canada pharmacy viagra 25mg|order cialis vs viagra|price of a viagra pill|viagra cialis precios|fast viagra uk|newest viagra|le viagra pourquoi|is generic viagra avaikable|viagra reacciones adversa|discount viagra samples|we choice viagra tablets|click here viagra headaches|inc viagra india|viagra osterreich bestellen|viagra pens for sale|viagracanada|generic viagra wholesale price|are branded indian viagra safe|is viagra available in generic|cheap viagra or sale|buy real viagra coat sale|does generic viagra work|viagra sans ordonnance magasin|viagra 50mg for sale ireland|viagra rezept online erhalten|viagra blood pressure drop|viagra 25 mg tab|wow look it woman and viagra|dosis viagra efectos|how to buy viagra in abu dhabi|viagra feminin sans ordonnance|cialis viagra espana|viagra es con receta medic|online website viagra|viagra subistute|pfizer viagra vendita|viagra chewable tablets|viagra potenzmitte|sizes viagra|dangers of viagra abuse|where can i buy viagra in usa|visit web site ordering viagra|viagra kaufen mit rezep|sildenafil viagra pfizer|viagra tylenol trial|buy viagra in phuket|best viagra to buy online|prix de viagra rx|lgislation suisse viagra|mail order viagra jelly|we like it viagra prices|movie viagra sales|viagra gold pris fass|history of viagra sales|visit our site brand viagra|sconto di viagra di erba|onet viagra pharmacy|viagra soft mg buy|super viagra beads|cheap viagra online ireland|buying viagra in australia|dove acquistare viagra lin|wirkungsdauer levitra viagra|viagra sale los angeles|viagra cost nz|lowcostviagra|viagra vrai pas cher|viagra pakistan price|viagra order in india|achat viagra pfizer|mejor viagra herbario|viagra as performance booster|comprar viagra en europa|take sotalol and viagra|wow look it viagra tab|will viagra become generic|canada generic viagra pharmacy|viagra espaa farmacias|generic viagra best price|can tou get pregnant on viagra|10mg vs 20mg viagra|viagra prices from walmart|viagra zu teuer|only here viagra injectable|advertised on fox viagra|viagra costco over the counter|rezeptfreie viagra|compro viagra en valencia|private label herbal viagra|generic viagra gel|pillole viagra|pfizer viagra 50mg flashback|viagra alternatives|buy viagra in kenya|viagra preis deutschlan|viagra kaufen einzeln 100mg|prezzo basso viagra generico|best herbal viagra reviews|genericos de viagra en chile|red cialis viagra drug|serios viagra bestellen|viagra auf rechnung online|viagra at gnc|pfizer viagra dosage|viagra cost sa|viagra price made pfizer|viagra kostenlos|precio viagra farmacia|viagra samples free pfizer|viagra generique teva|visit our site take viagra|visit our site viagra fast|ja existe generico do viagra|order viagra online safe|viagra utrecht|100mg super viagra 60mg|viagra online for sale cheap|viagra 50 o 100 mg|visit web site rx viagra|generic viagra meltabs drug|vendita viagra in contrassegno|can i get viagra at walgreens|cialis compare levitra viagra|tab viagra generic buy|viagra cheap online uk|fda approved viagra sales|viagra use experience|generic viagra safe india|we use it brand name viagra|prix viagra 50 100|generic names of viagra|viagra tablet bestellen|viagra plus cost comparison|female viagra sale uk|buy viagra viagra
[url=http://viagracheapbyg.com/]viagra,cheap viagra,buy viagra,generic viagra,viagra online,buy viagra online,viagra,viagra cheap,online viagra[/url]
viagra,cheap viagra,buy viagra,generic viagra,viagra online,buy viagra online,viagra,viagra cheap,online viagra
viagra con receta espana|viagra professional australia|viagra online pharmacy india|buy viagra 50 mg online|ik wil viagra bestellen|vente viagra kamagr|compra viagra online espana|meilleur site achat viagra|the best site viagra sales|femminile viagra|viagra cost without insurance|tabs viagra 50mg 100mg|cialis viagra best price|are generic viagra any good|a free sample of viagra|buy cheapest generic viagra|viagra to order|click now viagra 25 mg order|viagra kautabletten|viagra usa kauf|australia viagra barata|viagra 60mg|viagra pfizer teva|buy pills like viagra|cialis viagra onlin|most recognized brand viagra|viagra im internet gefahrlich|viagra dnemark rezeptfrei|the best female viagra|viagra generische cialis|cheap viagra fast|viagra soft tabs dosage|pl viagra|frauen viagra verkauf online|usefull link viagra online buy|viagra 25 effett|assunzione viagra cialis|pharmatheke viagra|viagra 100mg long does last|vente viagra naturel|click now online viagra in u s|viagra comment fair|discount viagra rx|is generic viagra legal|viagra per pill cost uk|only here viagra buy uk|viagra online discreet|we use it buy viagra us|viagra edrugstore|mytabs viagra|prix officiel viagra belgique|viagra victoria australia|safest cheapest viagra|viagra 100 street price|order viagra soft|shoud you buy viagra|viagra vs cialis forum|venta de viagra ny|can you drink alcohol viagra|delivery uk fast viagra|donde comprar viagra en la web|viagra y derivado|viagra india|order viagra over phone|follow link viagra pill|womens viagra forum|cheap viagra ontario|buy viagra online uk paypal|cost of viagra jelly|viagra generic soft tabs 50mg|buy viagra here in the uk|viagra and levitra dosage|use of viagra jelly|is maximum dosage for viagra|generic versions of viagra|viagra en pharmacie tunisie|pfizer viagra 100mg women|mejor viagra o cialis|buy viagra gold coast|viagra vendita offerta|50 mg viagra not working|tesco pharmacy online viagra|compare viagra prices|buy pharmacy generic viagra|pfizer viagra achat canada|viagra abu dhabi|viagra rezept arzt|stamina rx vs viagra|buy viagra t shirt|pfizer viagra prezzo|buy female viagra with e check|viagra levitra and tadalafil|click now viagra mail order|cheapest viagracouk|acheter viagra qualit|viagra ecstasy|viagra effet contraire|viagra en oferta|viagra in taiwan|best viagra jelly prices|viagra real mail|viagra sperm count|viagra ejaculation precoce|prix du viagra pfizer|buy viagra onli ne|viagra avec cialis|is viagra bad for the heart|when do take a viagra pill|buy viagra in malaysi|brand viagra over the net|generic viagra illegal|viagra teenage use|buy viagra in nigeria|viagra cialis experiencias|viagra online a href|canada pharmacy viagra 25mg|order cialis vs viagra|price of a viagra pill|viagra cialis precios|fast viagra uk|newest viagra|le viagra pourquoi|is generic viagra avaikable|viagra reacciones adversa|discount viagra samples|we choice viagra tablets|click here viagra headaches|inc viagra india|viagra osterreich bestellen|viagra pens for sale|viagracanada|generic viagra wholesale price|are branded indian viagra safe|is viagra available in generic|cheap viagra or sale|buy real viagra coat sale|does generic viagra work|viagra sans ordonnance magasin|viagra 50mg for sale ireland|viagra rezept online erhalten|viagra blood pressure drop|viagra 25 mg tab|wow look it woman and viagra|dosis viagra efectos|how to buy viagra in abu dhabi|viagra feminin sans ordonnance|cialis viagra espana|viagra es con receta medic|online website viagra|viagra subistute|pfizer viagra vendita|viagra chewable tablets|viagra potenzmitte|sizes viagra|dangers of viagra abuse|where can i buy viagra in usa|visit web site ordering viagra|viagra kaufen mit rezep|sildenafil viagra pfizer|viagra tylenol trial|buy viagra in phuket|best viagra to buy online|prix de viagra rx|lgislation suisse viagra|mail order viagra jelly|we like it viagra prices|movie viagra sales|viagra gold pris fass|history of viagra sales|visit our site brand viagra|sconto di viagra di erba|onet viagra pharmacy|viagra soft mg buy|super viagra beads|cheap viagra online ireland|buying viagra in australia|dove acquistare viagra lin|wirkungsdauer levitra viagra|viagra sale los angeles|viagra cost nz|lowcostviagra|viagra vrai pas cher|viagra pakistan price|viagra order in india|achat viagra pfizer|mejor viagra herbario|viagra as performance booster|comprar viagra en europa|take sotalol and viagra|wow look it viagra tab|will viagra become generic|canada generic viagra pharmacy|viagra espaa farmacias|generic viagra best price|can tou get pregnant on viagra|10mg vs 20mg viagra|viagra prices from walmart|viagra zu teuer|only here viagra injectable|advertised on fox viagra|viagra costco over the counter|rezeptfreie viagra|compro viagra en valencia|private label herbal viagra|generic viagra gel|pillole viagra|pfizer viagra 50mg flashback|viagra alternatives|buy viagra in kenya|viagra preis deutschlan|viagra kaufen einzeln 100mg|prezzo basso viagra generico|best herbal viagra reviews|genericos de viagra en chile|red cialis viagra drug|serios viagra bestellen|viagra auf rechnung online|viagra at gnc|pfizer viagra dosage|viagra cost sa|viagra price made pfizer|viagra kostenlos|precio viagra farmacia|viagra samples free pfizer|viagra generique teva|visit our site take viagra|visit our site viagra fast|ja existe generico do viagra|order viagra online safe|viagra utrecht|100mg super viagra 60mg|viagra online for sale cheap|viagra 50 o 100 mg|visit web site rx viagra|generic viagra meltabs drug|vendita viagra in contrassegno|can i get viagra at walgreens|cialis compare levitra viagra|tab viagra generic buy|viagra cheap online uk|fda approved viagra sales|viagra use experience|generic viagra safe india|we use it brand name viagra|prix viagra 50 100|generic names of viagra|viagra tablet bestellen|viagra plus cost comparison|female viagra sale uk|buy viagra viagra
online gambling app for ipad
strat roulette
online casino for gambling
[url=http://onlineroulette.space/#]roulette free[/url]
play penny slots online real money
one casino
us friendly online roulette
[url=http://online-casino.party/#]online casino[/url]
best real money casino online
casino slots
online casino us credit card
[url=http://online-slots.party/#]slots online[/url]
rtg casino for ipad
especialistas
[url=http://candiancialisuy.com/]generic cialis online[/url]
generic cialisviagra para comprar barato
[url=http://viagralkas.com/]viagra online[/url]
viagra cheapviagra marque
[url=http://viagranelius.com/]cheap viagra online[/url]
buy viagra online
online gambling with real money
online gambling casino usa
usa gambling sites online
[url=http://onlineroulette.space/#]online casino playing[/url]
real vegas online instant play
roulette casinos
honest online casinos usa
[url=http://online-casino.party/#]roulette in online casinos[/url]
onbling casino download
casino online
usa online gambling site
[url=http://online-slots.party/#]casino real money[/url]
best mobile casino bonuses
live dealers roulette online casinos
free roulette games
are there any online gambling sites left
[url=http://onlineroulette.space/#]roulette kostenlos spielen[/url]
best online casino on the internet
free online casino
online poker casino usa
[url=http://online-casino.party/#]online casino games[/url]
bingo
best online slots
australian online pokies real money
[url=http://online-slots.party/#]slots online[/url]
online casino accepts paypal us
cost of cialis professional|wow cialis tadalafil 100mg|shelf life of cialis|precios de cialis en india|legal cost of cialis|comprar cialis profesiona|cialis tadalafil 20 mg tablets|cialis with 2 days delivery|recommended cialis dosage|cialis price amazon|buying cialis soft tabs|cialis femenino en lnea|20 use mg cialis for|cialis made in the usa|cialis dosage for altitude|brand cialis in the uk|cialis drug company|cialis alternative uses|acquisto cialis cipla|cialis 20 mg vademecu|generic cialis tadalafil 10 mg|buy cialis online in vancouver|effet secondaire cialis 20 m|cialis patent uk|cialis black 100mg|cialis con receta precio|i recommend cialis strenght mg|cialis professional quando|female herbal cialis|cialis kaufen frankreic|buy cialis from ghana|30 mg cialis generici|cialis 5mg daily price|cialis 20mg apotheke|remarquez cialis en ligne|le meilleur prix cialis le ru|inexpensive cialis pharmacy|apotheke cialis bestellen|muestra libre cialis|cialis daily use prices|is cialis on line safe|i recommend buy cialis on line|cialis generika potenzmitte|cialis original forum|cialis tv commercial 2011|cialis insurance cost|tomar cialis sin necesitarl|comprar cialis generico net|cialis 5 mg cost canada|cost for cialis canada|day next cialis online|cialis comprar espana|cialis 25mg price|il cialis comment|low cost cialis|precio cialis 10|cialis buy cheap online|very good site buy cialis on|usefull link cialis online usa|visit web site cialis generico|who can prescribe cialis|precio cialis mexic|generic cialis pills|cialis 5 mg mexico|cialis til damer|we like it cialis cost|cialis eu apotheke|cialis prodaja|what are cialis pills order|cialis 5mg niederlande|brand cialis china supplier|cialis black uk|doses do cialis|we recommend cialis capsules|visit web site sale cialis|cialis compra de egipto|en ligne escompte de cialis|cialis mezza|cialis cuanto cuesta en espana|cialis billig|cialis probe|tienda cialis en lnea barato|cialis 1 to 2 days shipping|cialis canada sale|buying cialis au|nombre de cialis generico|cialis online |order brand cialis australia|prescription cialis suisse|cialis wikipedia suomi|cialis cost in us|comprar cialis en ny|buy cialis generic no rx|look there herbal cialis|non prescription cialis canada|cialis generico economico|cialis daily prices|cialis target|cialis 20 maximum mg|purchase cialis pills|without cialis free|we recommend cialis on line|usefull link cialis canadian|cialis prezzi|cheap cialis uk prices|cialis soft paypal cheapest|try it purchase cialis 5 mg|acquisto di 20 mg di cialis|cialis supreme suppliers|vente cialis pharmacie france|visit web site how much cialis|gdzie kupic cialis w uk|cialis no insurance|cialis amrica barata|cialis sur eba|cialis generique prix|look there cialis cheep|achat cialis online|cialis and generic cialis|prescription cialis cost|cialis filmtabletten 5mg|we use it cialis generic brand|rs cialis gnrique|cialis farmacie italiane|mejor cialis o levitra|two 20mg cialis|cheap cialis tadalafil 20 mg|brand cialis to buy online|achat sur cialis|get a cialis prescription|getting pregnant on cialis|cialis reviews user|cialis before surgery|the best place cialis|rezeptfrei cialis bestellen|cialis e occhio|generic cialis paypal|cialis 36|i recommend wwwcialiscom|acheter cialis 10mg en france|cialis online vancouve|how much does cialis cost|we recommend chip cialis|the best site price of cialis|cialis generic fast|cialis 5mg help with breathing|tienda de los cialis|cialis aus holland|cialis same day shipping|cialis en europe|cialisverkauf 1 mg|cialis online cost|i use it soft cialis|very good site real cialis|cialis uso diario precio|difference cialis 10mg 20mg|cialis markenpillen|cialis buy online 5mg|cialis en yaho|generic cialis good brand|acheter cialis 5 milligrams|preisvergleich cialis levitra|wow look it cialis daily|daily cialis blood pressure|where to get cialis in uk|cialis 5 quanto costa|cialis fastest delivery online|i use it buy cialis china|escompte lgitime cialis|are generic cialis pills safe|combien coute le cialis 20mg|cialis tablets other|cialis senza ricetta yahoo|cialis quelle dose|buy cialis lilly icos in box|cialis genericos for|buy super cialis online|we recommend cialis no rx|generic option for cialis|online meds cialis|cialis levitra precio|cost for cialis 10mg|cialis 10 doctissim|cialis uk|generic cialis black|does cialis work for bph|generisches cialis 50mg|kaiser price for cialis|venta de profesional de cialis|cialis soft tabs side effects|5 mg daily cialis cost|cialis online italia|try it getting cialis|order cialis prescription|comprar cialis en panam|remedio cialis generico|wirkung cialis 20mg|cialis order from europe blog|comprar cialis almeria|just try buy cheapest cialis|the best site cialis samples|pharmacy com cialis|venta de cialis 20mg|cialis curativo|we like it order cialis canada|cialis online online pharmacy|buy 25 mg cialis online|prezzo pastiglie cialis|best price prescription cialis|cialis recepta|buy cialis in israel|uk pharmacy cialis online|cost low dose cialis|pillola cialis 5mg|price of real cialis|precio cialis contrareembolso|switzerland generic cialis|cialis 2 5 mg online|take cialis before going out|cialis en lnea aus|usefull link soft tab cialis|best generic drugs cialis|cialis prices amazon|cialis super barata|cialis 20 mg in farmacia|click here cialis online shop|type web cialis|buy cialis cheap from canada|black cialis uk|costo cialis 5|shop on line for cialis|cialis venta argentina|soft tab cialis|comprar cialis ms barato|can you buy cialis on line|comprar cialis 5mg no brasil|cialis discount voucher|vendo cialis torino|best cialis generic deals|cialis super active pumpe|buy official cialis|cheapest cialis 60mg|cialis pharmacy cost|cialis del campione libero|brand cialis cheapest price|cialis en pharmacie forum|i use it cheapest cialis 20mg|look here cialis philippines|generici di cipla cialis|look here cialis online
[url=http://cialisgenilo.com/cialis_cheap.html]cialis cheap,cheap cialis online,generic cialis online,generic cialis,cialis cheap,cialis online,buy cialis,cialis[/url]
cialis cheap,cheap cialis online,generic cialis online,generic cialis,cialis cheap,cialis online,buy cialis,cialis
cost of cialis professional|wow cialis tadalafil 100mg|shelf life of cialis|precios de cialis en india|legal cost of cialis|comprar cialis profesiona|cialis tadalafil 20 mg tablets|cialis with 2 days delivery|recommended cialis dosage|cialis price amazon|buying cialis soft tabs|cialis femenino en lnea|20 use mg cialis for|cialis made in the usa|cialis dosage for altitude|brand cialis in the uk|cialis drug company|cialis alternative uses|acquisto cialis cipla|cialis 20 mg vademecu|generic cialis tadalafil 10 mg|buy cialis online in vancouver|effet secondaire cialis 20 m|cialis patent uk|cialis black 100mg|cialis con receta precio|i recommend cialis strenght mg|cialis professional quando|female herbal cialis|cialis kaufen frankreic|buy cialis from ghana|30 mg cialis generici|cialis 5mg daily price|cialis 20mg apotheke|remarquez cialis en ligne|le meilleur prix cialis le ru|inexpensive cialis pharmacy|apotheke cialis bestellen|muestra libre cialis|cialis daily use prices|is cialis on line safe|i recommend buy cialis on line|cialis generika potenzmitte|cialis original forum|cialis tv commercial 2011|cialis insurance cost|tomar cialis sin necesitarl|comprar cialis generico net|cialis 5 mg cost canada|cost for cialis canada|day next cialis online|cialis comprar espana|cialis 25mg price|il cialis comment|low cost cialis|precio cialis 10|cialis buy cheap online|very good site buy cialis on|usefull link cialis online usa|visit web site cialis generico|who can prescribe cialis|precio cialis mexic|generic cialis pills|cialis 5 mg mexico|cialis til damer|we like it cialis cost|cialis eu apotheke|cialis prodaja|what are cialis pills order|cialis 5mg niederlande|brand cialis china supplier|cialis black uk|doses do cialis|we recommend cialis capsules|visit web site sale cialis|cialis compra de egipto|en ligne escompte de cialis|cialis mezza|cialis cuanto cuesta en espana|cialis billig|cialis probe|tienda cialis en lnea barato|cialis 1 to 2 days shipping|cialis canada sale|buying cialis au|nombre de cialis generico|cialis online |order brand cialis australia|prescription cialis suisse|cialis wikipedia suomi|cialis cost in us|comprar cialis en ny|buy cialis generic no rx|look there herbal cialis|non prescription cialis canada|cialis generico economico|cialis daily prices|cialis target|cialis 20 maximum mg|purchase cialis pills|without cialis free|we recommend cialis on line|usefull link cialis canadian|cialis prezzi|cheap cialis uk prices|cialis soft paypal cheapest|try it purchase cialis 5 mg|acquisto di 20 mg di cialis|cialis supreme suppliers|vente cialis pharmacie france|visit web site how much cialis|gdzie kupic cialis w uk|cialis no insurance|cialis amrica barata|cialis sur eba|cialis generique prix|look there cialis cheep|achat cialis online|cialis and generic cialis|prescription cialis cost|cialis filmtabletten 5mg|we use it cialis generic brand|rs cialis gnrique|cialis farmacie italiane|mejor cialis o levitra|two 20mg cialis|cheap cialis tadalafil 20 mg|brand cialis to buy online|achat sur cialis|get a cialis prescription|getting pregnant on cialis|cialis reviews user|cialis before surgery|the best place cialis|rezeptfrei cialis bestellen|cialis e occhio|generic cialis paypal|cialis 36|i recommend wwwcialiscom|acheter cialis 10mg en france|cialis online vancouve|how much does cialis cost|we recommend chip cialis|the best site price of cialis|cialis generic fast|cialis 5mg help with breathing|tienda de los cialis|cialis aus holland|cialis same day shipping|cialis en europe|cialisverkauf 1 mg|cialis online cost|i use it soft cialis|very good site real cialis|cialis uso diario precio|difference cialis 10mg 20mg|cialis markenpillen|cialis buy online 5mg|cialis en yaho|generic cialis good brand|acheter cialis 5 milligrams|preisvergleich cialis levitra|wow look it cialis daily|daily cialis blood pressure|where to get cialis in uk|cialis 5 quanto costa|cialis fastest delivery online|i use it buy cialis china|escompte lgitime cialis|are generic cialis pills safe|combien coute le cialis 20mg|cialis tablets other|cialis senza ricetta yahoo|cialis quelle dose|buy cialis lilly icos in box|cialis genericos for|buy super cialis online|we recommend cialis no rx|generic option for cialis|online meds cialis|cialis levitra precio|cost for cialis 10mg|cialis 10 doctissim|cialis uk|generic cialis black|does cialis work for bph|generisches cialis 50mg|kaiser price for cialis|venta de profesional de cialis|cialis soft tabs side effects|5 mg daily cialis cost|cialis online italia|try it getting cialis|order cialis prescription|comprar cialis en panam|remedio cialis generico|wirkung cialis 20mg|cialis order from europe blog|comprar cialis almeria|just try buy cheapest cialis|the best site cialis samples|pharmacy com cialis|venta de cialis 20mg|cialis curativo|we like it order cialis canada|cialis online online pharmacy|buy 25 mg cialis online|prezzo pastiglie cialis|best price prescription cialis|cialis recepta|buy cialis in israel|uk pharmacy cialis online|cost low dose cialis|pillola cialis 5mg|price of real cialis|precio cialis contrareembolso|switzerland generic cialis|cialis 2 5 mg online|take cialis before going out|cialis en lnea aus|usefull link soft tab cialis|best generic drugs cialis|cialis prices amazon|cialis super barata|cialis 20 mg in farmacia|click here cialis online shop|type web cialis|buy cialis cheap from canada|black cialis uk|costo cialis 5|shop on line for cialis|cialis venta argentina|soft tab cialis|comprar cialis ms barato|can you buy cialis on line|comprar cialis 5mg no brasil|cialis discount voucher|vendo cialis torino|best cialis generic deals|cialis super active pumpe|buy official cialis|cheapest cialis 60mg|cialis pharmacy cost|cialis del campione libero|brand cialis cheapest price|cialis en pharmacie forum|i use it cheapest cialis 20mg|look here cialis philippines|generici di cipla cialis|look here cialis online
bingo sites uk paypal
best online casino games
online video poker casinos
[url=http://onlineroulette.space/#]download casino poker[/url]
online gambling argentina
play roulette real money online
paypal new york gambling
[url=http://online-casino.party/#]play american roulette online[/url]
gambling us players
online casinos for us players
casino online accept paypal
[url=http://online-slots.party/#]online casino[/url]
best online blackjack yahoo
new weight loss medication
[url=http://regimenforfeit.com/]best diet supplements[/url]
weight loss for women
top weight loss supplements
direct casino merchant bank visa
roulette free play
jungle slots online casino
[url=http://onlineroulette.space/#]play roulette for free[/url]
online casinos that accept american express
hypercasinos
online casinos mit live roulette
[url=http://online-casino.party/#]onlinecasino[/url]
start online casino
virgin slots
ipad casino real money usa
[url=http://online-slots.party/#]best online slots[/url]
american roulette
what do cialis pills look like
cialis generic
cheap cialis in sydney
[url=http://cialisrydfgj.com/#]generic cialis tadalafil[/url]
cialis generique discount
coupon for cialis
cuanto sale pastilla cialis
[url=http://cialistiutyjdg.com/#]buy cialis online[/url]
cialis cheap usa
online gambling casino bodog
online casinos with instant payouts
gambling internet slots casino
[url=http://onlineroulette.space/#]u s based online casino[/url]
casino internet games
grand roulette online game
best online casino to play roulette
[url=http://online-casino.party/#]online casino roulette echtes geld[/url]
casino online argentina paypal
casino real money
real gambling on iphone
[url=http://online-slots.party/#]online casinos for us players[/url]
play at casino online
new weight loss medication
[url=http://regimenforfeit.com/]weightloss pills[/url]
prescription diet pills
weight loss prescription drugs
dosa cialis
[url=http://candiancialisuy.com/]cialis cheap[/url]
cheap cialisviagra soft
[url=http://viagralkas.com/]online viagra[/url]
buy viagrai use it viagra generic online
[url=http://viagranelius.com/]generic viagra[/url]
generic viagra online
[url=http://baumarktxxx.eu/]http://baumarktxxx.eu/[/url] PlerlyMoldNewweari , Einhell Bohrhammer BT-RH 1500
donde puedo comprar viagra en la plata
buy sildenafil citrate online
can i get viagra on medical card
[url=http://viagrawayshfj.com/#]sildenafil online[/url]
can you just buy viagra
generic for viagra
brand viagra online canada
[url=http://sildenafilvcnfgjty.com/#]viagra online[/url]
buy cialis viagra levitra
cvs pharmacy price viagra
buy sildenafil online
generic viagra now available
[url=http://viagrawayshfj.com/#]sildenafil generic[/url]
viagra and levitra together
generic viagra online pharmacy
viagra sale spain
[url=http://sildenafilvcnfgjty.com/#]generic viagra 100mg[/url]
how to get high on viagra
autocad oem price
autocad 2015
autocad work online
[url=http://autocadgou.com/#]autocad electrical[/url]
autocad windows 7 download
autocad viewer
autocad lt 2011 upgrade
[url=http://autocadbmsa.com/#]autocad gratuit[/url]
autocad price for students
autocad viewe
companies using autocad software
[url=http://autocadtymafq.com/#]autocad 2018[/url]
autocad upgrade pricing
autocad 2012
autocad lite student version
[url=http://autocadbnaqk.com/#]cad software[/url]
2012 autocad serial number
autocad viewer
autocad architecture 2011 serial number product key
[url=http://autocadbmjes.com/#]autocad gratuit[/url]
autocad serial key 2014
autocad 2010
download autocad 2012 32 bit
[url=http://autocadtfesvb.com/#]autocad 2017 download[/url]
autocad 2000 software for sale
cialis 20mg pills
buy cialis online
cheap cialis in the usa
[url=http://uttcialisstdjfxhfdj.com/#]buy cialis[/url]
cialis cheap usa
tadalafil price
buy genuine cialis
[url=http://bftadalafiletuikh.com/#]tadalafil[/url]
liquid cialis for sale
[url=http://buecherx.eu/]http://buecherx.eu/[/url] PlerlyMoldNewweari , Die Stadt der Traumenden Bucher: Roman
we like it generic cialis pill
[url=http://candiancialisuy.com/]cheap cialis[/url]
cialis genericviagra e cib
[url=http://viagralkas.com/]online viagra[/url]
generic viagra onlinebargain viagra
[url=http://viagranelius.com/]viagra online[/url]
generic viagra online
cialis 20mg pills uk
[url=http://candiancialisuy.com/]buy cialis[/url]
generic cialis onlineviagra headquarters in canada
[url=http://viagralkas.com/]buy viagra[/url]
canadian viagracheap genuine viagra uk
[url=http://viagranelius.com/]generic viagra online[/url]
buy generic viagra
microsoft outlook
windows 8
make google default search engine windows 10
[url=http://opgemmje.com/#]windows 10 download[/url]
windows update catalog
c programdata microsoft windows start menu programs
windows 10 store
microsoft silverlight
[url=http://opgemmje.com/#]windows update[/url]
windows media player
[url=http://ordercialisjlp.com/]http://ordercialisjlp.com/[/url] PlerlyMoldNewweari , Sleep Apnea and Congestive Heart Failure
can buy cialis uk
cialis coupons 2018
buy generic cialis paypal
[url=http://ytfcialisnkrt.com/#]cheap cialis[/url]
order generic cialis online no prescription
generic cialis 2018
how to buy generic cialis online
[url=http://whcialisxdutrj.com/#]cialis coupon[/url]
where is the cheapest place to buy cialis
cheap cialis next day shipping
cialis coupons 2018
buy cialis online in uk
[url=http://ytfcialisnkrt.com/#]cheap cialis[/url]
cialis buy europe
generic cialis tablets
quality cheap meds pills cialis
[url=http://whcialisxdutrj.com/#]generic cialis at walmart[/url]
cialis canada discount
microsoft office login
windows server
stegbar windows
[url=http://opgemmje.com/#]windows 10 store[/url]
microsoft rewards
[url=http://www.ativanx.com/]http://www.ativanx.com/[/url] PlerlyMoldNewweari , [url=http://www.ativanx.com/]http://www.ativanx.com/[/url] PlerlyMoldNewweari
[url=http://laufsporty.eu/]http://laufsporty.eu/[/url] PlerlyMoldNewweari , JKFitness Racing 545 Indoor Cycle
what is the best online pharmacy for viagra
viagra without a prescription
buy sildenafil citrate online uk
[url=http://szviagrahqegh.com/#]viagra without doctor[/url]
brand viagra 50 mg
viagra online
how much per viagra pill
[url=http://kcviagratykfgj.com/#]viagra online[/url]
cheapest viagra in melbourne
how long does one viagra pill last
viagra no pres
sildenafil wholesale
[url=http://szviagrahqegh.com/#]viagra no pres[/url]
get high off viagra
viagra coupons
cheap genuine viagra uk
[url=http://kcviagratykfgj.com/#]viagra prices[/url]
can you buy viagra over counter us
[url=http://healthclue.eu/]http://healthclue.eu/[/url] PlerlyMoldNewweari , Halo Oral Antiseptic, Berry, 1 oz
[url=http://learningclue.eu/]http://learningclue.eu/[/url] PlerlyMoldNewweari , [url=http://learningclue.eu/]http://learningclue.eu/[/url] PlerlyMoldNewweari
buy cialis online in u.k
cialis cost
order viagra cialis
[url=http://gacialisdtiyk.com/#]buy cialis[/url]
how to order cialis online no prescription
cialis coupons
cialis online cheap
[url=http://vxcialistoufjg.com/#]cialis coupon[/url]
safe place to buy cialis
[url=http://educationpoints.eu/]http://educationpoints.eu/[/url] PlerlyMoldNewweari , Student DriverJ717 8 inch driver’s education Sticker decal
viagra 100mg generic
buy viagra online
get maximum results viagra
[url=http://fvviagrayrtuedf.com/#]viagra on line[/url]
can i buy viagra in london
generic viagra online
safe place to buy viagra uk
[url=http://dmviagratruykfj.com/#]generic viagra online[/url]
generico do viagra e cialis
[url=http://educationtip.eu/]http://educationtip.eu/[/url] PlerlyMoldNewweari , Reference and Education
cheapest viagra online place to buy viagra
cheap viagra
india viagra generic
[url=http://fvviagrayrtuedf.com/#]online viagra[/url]
prices viagra 100mg
buy generic viagra online
viagra online orders
[url=http://dmviagratruykfj.com/#]buy generic viagra online[/url]
new female viagra pill
viagra vs cialis which is cheaper
viagra price
get viagra emails
[url=http://fvviagrayrtuedf.com/#]viagra online[/url]
azul generico do viagra
buy generic viagra online
where can i buy viagra online uk
[url=http://dmviagratruykfj.com/#]viagra generic[/url]
where to buy viagra online forum
[url=http://emcm.eu/]http://emcm.eu/[/url] InetueneDerce , Sanct Bernhard Propolis flussig- 30 ml
[url=http://emcm.eu/]http://emcm.eu/[/url] InetueneDerce , Sanct Bernhard Propolis flussig- 30 ml
[url=http://navrcholu.eu/]http://navrcholu.eu/[/url] InetueneDerce , AMARETTA TV Hifi Tisch Board Lowboard Phono Schrank
cheap cialis drug
generic cialis sale
cheap cialis for sale
[url=http://sacialisguyid.com/#]generic cialis price[/url]
buy cialis tablets
cialis online
buy cialis from canada online
[url=http://gecialishjufh.com/#]online cialis[/url]
how to order cialis online safely
mens health forum generic viagra
viagra without a doctor prescription
viagra online bestellen verboten
[url=http://smviagraytjdg.com/#]viagra[/url]
does viagra target
viagra cheap
buy viagra canadian pharmacy
[url=http://kfviagraweyj.com/#]viagra pills[/url]
viagra online kaufen niederlande
casino games slots free heart of vegas
[url=http://casinoline17.com/]casino games free[/url]
online casinos for us players
casino games slots
o viagra generico
viagra without a doctor prescription
generika sildenafil 100mg
[url=http://smviagraytjdg.com/#]viagra without a doctor[/url]
viagra generico puebla
viagra cheap
do i need a prescription to order viagra
[url=http://kfviagraweyj.com/#]viagra prices[/url]
medecin generaliste viagra
cialis e hipertensao
http://cialisles.com generic cialis online
leg pain with cialis
generic cialis
does cialis affect blood sugar
[url=http://cialisles.com/]cialis[/url]
can you take cialis with priligy
buy levitra from u.s. pharmacy
levitra générique sites sûrs
cheap viagra and levitra
[url=http://yourlevitrabgk.com/#]buy levitra[/url]
levitra for sale online
viagra 25mg 50mg 100mg medicine
viagra without a prescription
where can you buy viagra yahoo
[url=http://vfviagratyit.com/#]viagra without a doctor prescription[/url]
buy viagra cheap canada
buy viagra online
cialis viagra online canada
[url=http://jfviagrayhf.com/#]online viagra[/url]
generic viagra available walgreens
buy sildenafil citrate in australia
viagra without a doctor's prescription
viagra cost per pill 2012
[url=http://vfviagratyit.com/#]viagra without a doctor prescription[/url]
viagra online kaufen niederlande
buy viagra
viagra online italia
[url=http://jfviagrayhf.com/#]online viagra[/url]
hard do you get viagra
[url=http://haushaltx.eu/]http://haushaltx.eu/[/url] InetueneDerce , Sofabett aus Schmiedeeisen : Modell CHICAGO
cialis discount coupon
cialis
order-cialis.com
[url=http://tmcialisutkfh.com/#]cialis online[/url]
cheapest pharmacy cialis
generic cialis
cheap-cialis.net
[url=http://fmcialisytjd.com/#]generic cialis tadalafil[/url]
cialis super active cheap
order levitra no prescription
levitra 60 mg
levitra buy online no prescription
[url=http://yourlevitrabgk.com/#]levitra[/url]
buy cialis levitra
cialis soft tablets
buy cialis online
buy cheap cialis link online
[url=http://tmcialisutkfh.com/#]cialis online[/url]
cialis discount pharmacy
cialis generic
generic cialis buy online
[url=http://fmcialisytjd.com/#]generic cialis[/url]
where can i buy real cialis
casino games roulette
[url=http://onlinelistcasino24.com/]casino games[/url]
play casinos
casino games real money
[url=http://sporteshop.eu/]http://sporteshop.eu/[/url] InetueneDerce , Puma Unisex-Erwachsene SF Drift Cat 5 Ultra Low-Top
cialis 30 day sample [url=http://kjcialishuef.us/#8115]generic cialis[/url] cialis cost cialis generic
is there a generic viagra drug
viagra without a doctor prescription
viagra sale las vegas
[url=http://fmviagraukfjg.com/#]viagra without a doctor's prescription[/url]
can i take 75 mg of viagra
buy viagra online
what is the cost of viagra pills
[url=http://javiagraryjdf.com/#]buy viagra[/url]
buy viagra in canada
is 100mg viagra is too much
viagra without doctor
sildenafil citrate 100 mg forum
[url=http://dnviagrarudfh.com/#]viagra without doctor[/url]
getting a viagra prescription
buy viagra
where to buy sildenafil citrate
[url=http://fdviagrakdgjfh.com/#]viagra online[/url]
se necesita receta medica para comprar viagra en mexico
do you have get prescription viagra
viagra without doctor
viagra online ohne rezept paypal
[url=http://dnviagrarudfh.com/#]viagra without a doctor prescription[/url]
wirkungsdauer viagra 50mg
viagra online
erfahrungsberichte viagra 50 mg
[url=http://fdviagrakdgjfh.com/#]buy viagra online[/url]
sildenafil 50 mg y 100mg
viagra generic for sale
viagra without prescription
safe buy generic viagra online
[url=http://dnviagrarudfh.com/#]viagra without doctor[/url]
viagra sale calgary
buy viagra online
how to buy viagra in uk
[url=http://fdviagrakdgjfh.com/#]viagra online[/url]
buy viagra jelly online
taking priligy and viagra together
viagra without a doctor prescription
20 mg levitra viagra
[url=http://dnviagrarudfh.com/#]viagra without prescription[/url]
online apotheke schweiz viagra
buy viagra
cheap viagra wholesale
[url=http://fdviagrakdgjfh.com/#]buy viagra[/url]
viagra 100 mg yan etkisi
contraindicaciones del sildenafil 50 mg
buy viagra online
viagra 50 mg effetti
[url=http://vkviagrayhf.com/#]buy viagra online[/url]
where to buy viagra in delhi
generic viagra online pharmacy
where to buy viagra in southampton
[url=http://anviagrasfhd.com/#]generic viagra online pharmacy[/url]
can get viagra nhs prescription
buy viagra uk quick delivery
buy viagra online
como usar o generico do viagra
[url=http://vkviagrayhf.com/#]viagra online[/url]
25mg vs 50mg viagra
viagra generic
viagra pills for women uk
[url=http://anviagrasfhd.com/#]buy generic viagra[/url]
sildenafil generico marca
prescription drugs online without
ventolin
canadian pharmacy reviews
[url=http://vjventolinuf.com/#]albuterol inhaler[/url]
pharmacy online
levothyroxine
pharmacy direct
[url=http://fksynthroidtja.com/#]levothyroxine[/url]
canadian pharmacy online
cialis canada
ventolin inhaler
Legitimate Canadian Mail Order Pharmacies
[url=http://vjventolinuf.com/#]ventolin[/url]
canada drug
levothyrox
buy medication without an rx
[url=http://fksynthroidtja.com/#]synthroid[/url]
canada pharmacy online
[url=http://viagrawithoutdoctorprescr.today/#7902]viagra without a doctor prescription[/url] viagra without a doctor prescription
generic cialis for sale in the u.k
buy generic cialis online
can buy cialis over counter
[url=http://dkcialislfn.com/#]generic cialis[/url]
can you cut cialis pills in half
cialis
safe place to buy cialis
[url=http://dtcialisfva.com/#]cialis online[/url]
buy cialis drugstore
cialis soft tabs cheap
generic cialis tadalafil
order cialis no prescription canada
[url=http://dkcialislfn.com/#]generic cialis online pharmacy[/url]
cheapest cialis au
cialis
buy cialis one a day
[url=http://dtcialisfva.com/#]online cialis[/url]
order cialis with paypal
viagra 100mg einnahme
online prescriptions
where can i get viagra in manchester
[url=http://viagrawyrfhdj.com/#]viagra without a doctor prescription[/url]
where to buy viagra sydney
online prescription
ok take 150mg viagra
[url=http://viagrarutjdfk.com/#]online prescription[/url]
purchase female viagra online
cheap cialis generic no prescription
buy generic cialis online
fake cialis pills
[url=http://dkcialislfn.com/#]cialis generic[/url]
buy cialis amsterdam
online cialis
discount generic cialis india
[url=http://dtcialisfva.com/#]cialis[/url]
cialis soft pills
viagra first time what to expect [url=http://viagratru.com]generic viagra review[/url] what is the advantage of viagra tablet
viagra generic name how to block viagra spam emails hotmail
http://viagratru.com - nuvigil and viagra
viagra sildenafil citrate 100mg
viagra
generic forms of viagra
[url=http://fmsviagrahddf.com/#]buy viagra online[/url]
age can you buy viagra
generic viagra
viagra pills men india
[url=http://gscviagratmn.com/#]buy generic viagra[/url]
viagra sildenafil citrate 50mg
buy viagra jelly online uk
viagra without prescription
cheap herbal viagra uk
[url=http://viagrawyrfhdj.com/#]viagra without doctor[/url]
cheap viagra online india
viagra without a prescription
viagra sale europe
[url=http://smviagraytjdg.com/#]viagra without prescription[/url]
very cheap generic viagra
It is truly a nice and useful piece of information. I am satisfied that you simply shared this helpful info with us. Please keep us informed like this. Thanks for sharing.
best canadian prescription prices
[url=http://canadianpharmacycubarx.com/#]canadian pharmacies online prescriptions[/url]
prescription prices comparison
aarp recommended canadian pharmacies
[url=http://drogeries.eu/]http://drogeries.eu/[/url] InetueneDerce , Ironmaxx Mineralkomplex- 130 Kapseln
viagra legales online-rezept
viagra online
target market viagra
[url=http://fmsviagrahddf.com/#]buy viagra[/url]
viagra buy cvs
viagra generic
where can i buy viagra
[url=http://gscviagratmn.com/#]buy generic viagra[/url]
how to get viagra in melbourne
buy herbal viagra high street
buy viagra online
viagra now online
[url=http://fmsviagrahddf.com/#]online viagra[/url]
can you take cialis viagra together
generic viagra online pharmacy
cual es el generico de la viagra
[url=http://gscviagratmn.com/#]buy generic viagra[/url]
what to tell the doctor to get viagra
[url=http://schmuckx.eu/]http://schmuckx.eu/[/url] InetueneDerce Damen Kristall Strass Perlen Haarekammen
viagra without a doctor’s prescription [url=http://viagrawithoutdoctorprescr.today/#7150]viagra without prescription[/url] viagra without a doctor viagra on line no prec
download
adobe cs6
adobe flash player
[url=http://gmadobefjm.com/#]adobe creative cloud download[/url]
adobe pdf
adobe photoshop cc
creative cloud desktop
[url=http://yoadobehekku.com/#]photoshop cc[/url]
crack adobe
O http://viagrawithoutdoctorntx.com caterpillar fungus indias viagra
where to buy viagra in bangkok [url=http://viagrawithoutdoctorntx.com/]viagra without a doctor[/url] wikipedia female viagra
where to buy viagra safe viagra without a doctor prescription viagra v
buy cialis nz
buy cialis
cialis thailand buy
[url=http://cialisifbnam.com/#]buy cialis[/url]
order cheap cialis online
generic cialis online
cialis for cheap
[url=http://tgjcialisopfg.com/#]generic cialis at walmart[/url]
genuine cialis sale
can you buy generic cialis usa
cheap cialis
cialis for sale in toronto
[url=http://cialisifbnam.com/#]buy cialis online[/url]
order cialis viagra
cialis generic
can you buy cialis mexico
[url=http://tgjcialisopfg.com/#]generic cialis 2018[/url]
buying cialis online uk
[url=http://educationpoints.eu/]http://educationpoints.eu/[/url] InetueneDerce , LEGO Education Large Building Plates
cialis and viagra taken together
viagra england
is ann summers blue pill viagra
[url=http://viagrafhnsau.com/#]viagra for sale uk only[/url]
where to buy viagra in new zealand
viagra pills 100 mg
viagra green pills
[url=http://dfvviagraujfdt.com/#]viagra tablet[/url]
generic viagra next day delivery uk
cheap levitra professional
levitra for sale
levitra sale online
[url=http://yourlevitrabgk.com/#]buy levitra on line[/url]
levitra for sale
[url=http://clomidrx.com/]http://clomidrx.com/[/url] InetueneDerce , Viagra and Cialis and Their Generic Counterparts
[url=http://kitchendeals.us/]http://kitchendeals.us/[/url] InetueneDerce , How Alprazolam worked?
crush viagra tablets
viagra without a doctor's prescription
using expired viagra pills
[url=http://fdkviagratrhge.com/#]viagra without a doctor prescription[/url]
pharmacy prices viagra
buy generic viagra online
viagra pill available india
[url=http://gkmviagragiuy.com/#]viagra generic[/url]
viagra pills uk
viagra for 17 year olds
http://cialisoni.com/ cialis coupon
viagra and diet
[url=http://cialisoni.com/]cialis coupon[/url]
where to buy viagra newcastle
tadalafil online
viagra with heart disease
gov uk buy viagra
viagra without prescription
sildenafil with 30mg of dapoxetine
[url=http://fdkviagratrhge.com/#]viagra without doctor[/url]
is there a generic viagra
generic viagra
get free viagra pills
[url=http://gkmviagragiuy.com/#]buy generic viagra[/url]
cipla sildenafil citrate tablets 100mg
generic female viagra sildenafil citrate
viagra without a doctor prescription usa
why is levitra cheaper than viagra
[url=http://viagrawithoutdoctorkjju.com/#]viagra without a doctors prescription[/url]
pfizer viagra price 100mg
buy generic viagra online
generic viagra where to buy
[url=http://hkcviagralvbqe.com/#]cheap viagra online[/url]
viagra online uk no prescription
viagra 50mg funciona
generic viagra without a doctor prescription
buy cheapest viagra online uk
[url=http://viagrawithoutdoctorkjju.com/#]viagra without a prior doctor prescription[/url]
good place buy viagra online
buy viagra online pharmacy
viagra sales numbers
[url=http://hkcviagralvbqe.com/#]buy viagra for sale online[/url]
foro sobre viagra generica
Online Pharmacies
legitimate canadian mail order pharmacies
top rated canadian pharmacies online
[url=http://cvcanadianpharmaciesghn.com/#]canadian pharmacies online prescriptions[/url]
canadian online pharmacy
canada pharmacies online prescriptions
canada pharmacies online prescriptions
[url=http://canadianpharmacyjkse.com/#]canadian pharmacies online prescriptions[/url]
Trusted Online Pharmacies
legitimate canadian mail order pharmacies
online pharmacies that do not require a prescription
[url=http://canadianonlinegha.com/#]canadian pharmacies online prescriptions[/url]
viagra canada
is there generic viagra yet
cheap viagra
do viagra pills expire
[url=http://vgviagrathmas.com/#]cheap viagra[/url]
can diabetics get free viagra
generic viagra without script
viagra schnell online
[url=http://viagragenericvghse.com/#]viagragenericvghse.com[/url]
is it legal to buy viagra in the uk
how many pills of viagra
generic viagra online
get rid viagra spam emails
[url=http://viagragenericvghse.com/#]generic viagra[/url]
blog viagra online
viagra without a doctor
buy viagra western union
[url=http://viagradoctorskllr.com/#]viagra without doctor[/url]
can buy viagra asda
can you buy viagra online ireland
generic viagra 100mg
safest place to order viagra
[url=http://viagragenericvghse.com/#]generic viagra[/url]
buy sildenafil over the counter
viagra without a doctor
doctors prescribe viagra online
[url=http://viagradoctorskllr.com/#]viagra without a doctor[/url]
viagra jelly sale uk
cialis buy online cheap
cialis coupon
cheap cialis 40 mg
[url=http://gvfcialisghna.com/#]cialis[/url]
cialis buy in australia
cialis generic
buy cialis with dapoxetine
[url=http://cialisgbnmse.com/#]cialis generic[/url]
how to buy cialis no prescription
buy+cialis+online+without+prescription+in+canada
cialis 20mg prix en pharmacie
generic cialis discount
[url=http://cialiscouponghndfe.com/#]cialis 5mg[/url]
buy cialis pakistan
cialis 20 mg best price
cialis rush order
[url=http://cialissalegbndet.com/#]cialis 5 mg[/url]
buy cialis super active online
order cialis online no prescription
cialis 20mg prix en pharmacie
buy cialis levitra and viagra
[url=http://cialiscouponghndfe.com/#]200 cialis coupon[/url]
cialis c20 pill
200 cialis coupon
cialis buy uk
[url=http://cialissalegbndet.com/#]cialis rezeptfrei[/url]
buy generic cialis professional
cheap cialis and viagra
cialis 20 mg best price
good place buy cialis
[url=http://cialiscouponghndfe.com/#]buy cialis online[/url]
buy cialis canada no prescription
200 cialis coupon
order cialis mexico
[url=http://cialissalegbndet.com/#]cialis rezeptfrei[/url]
cialis malaysia where to buy
cialis buy india
cheap cialis
buy cialis online in u.k
[url=http://cialiscouponghndfe.com/#]cialis pills[/url]
cialis discount pharmacy
cialis 5 mg
buy cialis no prescription uk
[url=http://cialissalegbndet.com/#]cialis 5 mg[/url]
buy cialis in italy
mail order viagra australia
viagra for sale
cheap viagra generic canada
[url=http://viagrasalesgogo.com/#]viagra sale[/url]
buy viagra dhaka
buying viagra online
buy viagra bali
[url=http://whereviagratognbt.com/#]buy viagra[/url]
buy viagra in dubai
donde comprar cialis generico argentina
ed pills
buy viagra in india mumbai
[url=http://edpillsfgbnd.com/#]ed pills[/url]
puedes comprar viagra en la farmacia
erection pills
cuanto vale viagra generico
[url=http://bestpillsforedfegge.com/#]ed pills that work[/url]
cheap cialis in the uk
take levitra 10mg
ed pills
use tadalafil 20mg
[url=http://edpillsfgbnd.com/#]ed pills that work[/url]
best online generic cialis
erectile dysfunction remedies
buy real viagra in australia
[url=http://bestpillsforedfegge.com/#]ed pills[/url]
buy cheap generic levitra
how to get your doctor to give you viagra
best ed pills
cialis levitra taken together
[url=http://edpillsfgbnd.com/#]ed pills[/url]
taking two 100 mg viagra
best ed pills
cialis diario 5mg preco
[url=http://bestpillsforedfegge.com/#]erection pills[/url]
tadalafil order
discount card for cialis
buy cialis online
buy cialis soft cheap
[url=http://buycialishjmfgj.com/#]buy cialis[/url]
discount viagra or cialis
cialis tablets
cheapest place to buy cialis online
[url=http://cialistabletfgbmas.com/#]cialis pills[/url]
order generic viagra cialis
buy cialis from europe
generic cialis online pharmacy
cialis pills picture
[url=http://cialisfbvghf.com/#]generic cialis[/url]
buy cialis china
cheap cialis
order cialis with prescription
[url=http://buycialishjmfgj.com/#]cialis online[/url]
cialis for sale in usa
follow link cialis low priced|cialis free trial|cialis compresse 5 m|cialis 5mg once day generico|descuento legtimo cialis|look here best price on cialis|kanada cialis levitra|just try 5 mg cialis|precio del cialis en farmacia|cialis en nicaragua|precios de cialis en|efectos de cialis en la muje|cialis comprar espaa|cialis 10 vidal|usa cialis a buon mercato|generico de cialis en espana|forum cialis gnrique|cialis pills from canada|cialis mexico over counter|low cost cialis softtabs|wow look it 100mg cialis|gunstig cialis kaufen|cialis 20mg achete|does cialis cause a cough|cialis brasil futbol|cialis pills 100mg|cialis wikipedia portugues|price of cialis in the us|cialis mg 5 prezzo|cialis for men|we use it online us cialis|side effects of cialis|link for you pill price cialis|cialis buy cheap best|buy cialis jelly|just try low cost cialis|cialis alcolici|cialis uk generique|cialis best cheap paypal|prix cialis 5mg cpr 28|comments cialis cheapest price|cialis suomi|vente cialis espagne|very good site cialis buy|sales cialis sell|cialis tabletas generico|cialis order by mail|only here soft gel cialis|cialis side effects flushing|cialis suppliers in uk|what is the price of cialis|securetabs online cialis 20mg|beda cialis 20mg dengan 80mg|generico cialis comprar|cialis 5mg best pricewalmart|cialis best price 4x 20 mg|discount cialis drugs|best price brand cialis in usa|appropriate dosage of cialis|cialis 20mg cpr4|levitra or cialis better|10mg cialis safe|cialis 5 mg dosi|sconto a cialis|generic cialis super|cialis hypertrophie prostate|cialis 5mg pharmacie suisse|40 cialis dosage|site acheter cialis|cialis europe pharmacy|the best choice cost cialis|cialis impotenci|cialis 5 mg wann wirkt es|cialis and bph|migliore farmacia cialis|cialis suppliers in the uk|compra cialis generico online|cialis moins cher lyo|discount cialis online mexico|link for you cialis tablet|cialis belge|cialis com free offer canada|cialis woman take|esperienze cialis|cheapest cialis mastercard|cialis in shopper drug mart|cialis krankenkasse|cialis pills in uk|cialis discount vioxx|patent expiration cialis|cialis levitra from canada|generici migliori cialis|costo cialis venezuela|cialis ou pas|lowest price cialis 20mg in az|cost of 20mg cialis|cialisco|the best place cialis for sale|two pills of cialis 20mg|cialis per paypal bezahlen|cialis bester preis|help orgasm could cialis men|cialis vendita generico|ordre du canada cialis|click now cialis 10 mg|cialis 5mg shelf life|preisvergleich cialis 20|cialis generico super active|sito cialis generico|compra cialis lin|10 mg cialis generici|niedrige cialis kosten|buy cialis kamagra australia|only now cialis soft|can i buy cialis at walmart|5 cialis generico sildenafil|daily doses of cialis|click here how to buy cialis|bangkok wholesale cialis|only now cialis next day|look there cialis legal|cialis soft online pharmacy|cialis rezeptfrei seris|cialis 20 mg presentation|ship generic cialis to canada|cialis 10 forum|acquistare cialis vendita|cialis overnight shipping us|cialis sin receta precio|buy female cialis visa|cialis uk sale|can 40mg of cialis hurt|pharmacie discount cialis|cialis tadalafil 20 mg bula|cialis sale cheap|cialis mail canada|cialis rezeptfrei kanada|precio cialis generico 20 m|discount coupon for cialis|how to buy cialis now|cialis black review|visit web site canadian cialis|precios de cialis en espaa|cialis 20 mg genricos suaves|cheap cialis from us|cialis soft medication online|cialis low cost generic|maximum possible dose cialis|cialis dosage 36 hour|cialis da 20 mg effetti|just try cialis uk|cialis on line shop|cialis for sale cheap|cialis soft tabs scam|cialis soft tablet sale|coste en lnea de cialis|cialis 10 et 20|2 cialis pills in one day|online cialis sicher|cialis filmtabletten prei|co cialis barata uk|order soft tab cialis|cialis 100mg di jakarta|cialis original bon marche|cialis jelly australia|get cialis overnight|cialis online kaufen express|cialis 5mg schweiz|buy cialis tab|pills cialis uk|buy cialis generic canada|kaufen gunstigsten cialis|cialis discount prescriptions|pastillas cialis barato|5 mg cialis preise|cialis kaufen thailand|refill cialis|best generic cialis for sale|cialis comprar andorra|the best site herbal cialis|cialis gel uk|cialis e bruciore di stomaco|should i take two 5mg cialis|is there a generic cialis drug|cialis forum review|follow link buy cialis generic|acquisto di farmaco di cialis|cialis generic online review|cialis tadalafil uk branded|cialis e simili|we choice cialis on line|cialis dosage|cialis standard dose|from how old can use cialis|cialis hinta|cialis 5 indications|cialis anwendung dosierung|cialis professionelle 100 mg|only today cialis discounts|cheapestcialis generic|is 25 mg of cialis enough|achat cialis ind|cialis pills for men|just try buy cialis australia|buy cialis in usa overnight|to cialis buy where|cialis soft bon marche|try it cialis generic|buying cialis on line in usa|cialis kaufen 20mg|the best site cialis in usa|vente de cialis en pharmacie|cialis e levitra come|cialis apotheke bern|taking cialis for fun|look there where buy cialis|prix de pharmacie pour cialis|cialis reviews patients|cialis kosten walmart|cialis online reviews|cialis 8 cpr riv 20 mg|enter site cialis in uk|cialis 40 mg buy|only here high quality cialis|very good site daily cialis|cialis 20 mg prix|cialis daily 25 mg cost|maximum safe dose cialis|where to buy tadalafil cialis|cialis double doses|cialis crea adiccion|cialis luxemburg|cialis 20 costo|cialis sublingual cheap|no prescription cialis soft|cialis|what does cialis cost per pill|cialis pills usa|just try cialis purchase|click now cialis in u s|rx discount cialis|cialis indiano per comprare|buy cialis on|cialis london uk|brand cialis zu verkaufen|what is order cialis soft tabs|wow generic cialis effective|how to use cialis video|cialisorderonline|cialis de 5mg precio en mexico
[url=http://cialisyqlw.com/]cheap cialis,cialis,buy cialis,generic cialis online,generic cialis,cialis cheap,cialis online,buy cialis,cialis[/url]
cheap cialis,cialis,buy cialis,generic cialis online,generic cialis,cialis cheap,cialis online,buy cialis,cialis
follow link cialis low priced|cialis free trial|cialis compresse 5 m|cialis 5mg once day generico|descuento legtimo cialis|look here best price on cialis|kanada cialis levitra|just try 5 mg cialis|precio del cialis en farmacia|cialis en nicaragua|precios de cialis en|efectos de cialis en la muje|cialis comprar espaa|cialis 10 vidal|usa cialis a buon mercato|generico de cialis en espana|forum cialis gnrique|cialis pills from canada|cialis mexico over counter|low cost cialis softtabs|wow look it 100mg cialis|gunstig cialis kaufen|cialis 20mg achete|does cialis cause a cough|cialis brasil futbol|cialis pills 100mg|cialis wikipedia portugues|price of cialis in the us|cialis mg 5 prezzo|cialis for men|we use it online us cialis|side effects of cialis|link for you pill price cialis|cialis buy cheap best|buy cialis jelly|just try low cost cialis|cialis alcolici|cialis uk generique|cialis best cheap paypal|prix cialis 5mg cpr 28|comments cialis cheapest price|cialis suomi|vente cialis espagne|very good site cialis buy|sales cialis sell|cialis tabletas generico|cialis order by mail|only here soft gel cialis|cialis side effects flushing|cialis suppliers in uk|what is the price of cialis|securetabs online cialis 20mg|beda cialis 20mg dengan 80mg|generico cialis comprar|cialis 5mg best pricewalmart|cialis best price 4x 20 mg|discount cialis drugs|best price brand cialis in usa|appropriate dosage of cialis|cialis 20mg cpr4|levitra or cialis better|10mg cialis safe|cialis 5 mg dosi|sconto a cialis|generic cialis super|cialis hypertrophie prostate|cialis 5mg pharmacie suisse|40 cialis dosage|site acheter cialis|cialis europe pharmacy|the best choice cost cialis|cialis impotenci|cialis 5 mg wann wirkt es|cialis and bph|migliore farmacia cialis|cialis suppliers in the uk|compra cialis generico online|cialis moins cher lyo|discount cialis online mexico|link for you cialis tablet|cialis belge|cialis com free offer canada|cialis woman take|esperienze cialis|cheapest cialis mastercard|cialis in shopper drug mart|cialis krankenkasse|cialis pills in uk|cialis discount vioxx|patent expiration cialis|cialis levitra from canada|generici migliori cialis|costo cialis venezuela|cialis ou pas|lowest price cialis 20mg in az|cost of 20mg cialis|cialisco|the best place cialis for sale|two pills of cialis 20mg|cialis per paypal bezahlen|cialis bester preis|help orgasm could cialis men|cialis vendita generico|ordre du canada cialis|click now cialis 10 mg|cialis 5mg shelf life|preisvergleich cialis 20|cialis generico super active|sito cialis generico|compra cialis lin|10 mg cialis generici|niedrige cialis kosten|buy cialis kamagra australia|only now cialis soft|can i buy cialis at walmart|5 cialis generico sildenafil|daily doses of cialis|click here how to buy cialis|bangkok wholesale cialis|only now cialis next day|look there cialis legal|cialis soft online pharmacy|cialis rezeptfrei seris|cialis 20 mg presentation|ship generic cialis to canada|cialis 10 forum|acquistare cialis vendita|cialis overnight shipping us|cialis sin receta precio|buy female cialis visa|cialis uk sale|can 40mg of cialis hurt|pharmacie discount cialis|cialis tadalafil 20 mg bula|cialis sale cheap|cialis mail canada|cialis rezeptfrei kanada|precio cialis generico 20 m|discount coupon for cialis|how to buy cialis now|cialis black review|visit web site canadian cialis|precios de cialis en espaa|cialis 20 mg genricos suaves|cheap cialis from us|cialis soft medication online|cialis low cost generic|maximum possible dose cialis|cialis dosage 36 hour|cialis da 20 mg effetti|just try cialis uk|cialis on line shop|cialis for sale cheap|cialis soft tabs scam|cialis soft tablet sale|coste en lnea de cialis|cialis 10 et 20|2 cialis pills in one day|online cialis sicher|cialis filmtabletten prei|co cialis barata uk|order soft tab cialis|cialis 100mg di jakarta|cialis original bon marche|cialis jelly australia|get cialis overnight|cialis online kaufen express|cialis 5mg schweiz|buy cialis tab|pills cialis uk|buy cialis generic canada|kaufen gunstigsten cialis|cialis discount prescriptions|pastillas cialis barato|5 mg cialis preise|cialis kaufen thailand|refill cialis|best generic cialis for sale|cialis comprar andorra|the best site herbal cialis|cialis gel uk|cialis e bruciore di stomaco|should i take two 5mg cialis|is there a generic cialis drug|cialis forum review|follow link buy cialis generic|acquisto di farmaco di cialis|cialis generic online review|cialis tadalafil uk branded|cialis e simili|we choice cialis on line|cialis dosage|cialis standard dose|from how old can use cialis|cialis hinta|cialis 5 indications|cialis anwendung dosierung|cialis professionelle 100 mg|only today cialis discounts|cheapestcialis generic|is 25 mg of cialis enough|achat cialis ind|cialis pills for men|just try buy cialis australia|buy cialis in usa overnight|to cialis buy where|cialis soft bon marche|try it cialis generic|buying cialis on line in usa|cialis kaufen 20mg|the best site cialis in usa|vente de cialis en pharmacie|cialis e levitra come|cialis apotheke bern|taking cialis for fun|look there where buy cialis|prix de pharmacie pour cialis|cialis reviews patients|cialis kosten walmart|cialis online reviews|cialis 8 cpr riv 20 mg|enter site cialis in uk|cialis 40 mg buy|only here high quality cialis|very good site daily cialis|cialis 20 mg prix|cialis daily 25 mg cost|maximum safe dose cialis|where to buy tadalafil cialis|cialis double doses|cialis crea adiccion|cialis luxemburg|cialis 20 costo|cialis sublingual cheap|no prescription cialis soft|cialis|what does cialis cost per pill|cialis pills usa|just try cialis purchase|click now cialis in u s|rx discount cialis|cialis indiano per comprare|buy cialis on|cialis london uk|brand cialis zu verkaufen|what is order cialis soft tabs|wow generic cialis effective|how to use cialis video|cialisorderonline|cialis de 5mg precio en mexico
[url=http://dekorshop.eu/]http://dekorshop.eu/[/url] InetueneDerce , Black+Decker Lithium-Ionen Rasentrimmer
Add Your Comments
|