If you could provide the excel file you use for this, and which Money reports you paste in to do it, that would be tremendous! I'm a huge fan of MS Money, but I've really been wanting to produce more detailed reports, exactly like the one above. The "monthly report" in Money is nice, but limited. Thanks a lot!!
Seventy accounts? No offense, but you are seriously pushing it with seventy accounts. The administrative burden alone is not worth the hassle. The multinational corporations I have worked for have hardly had seventy accounts. I would recommend you consolidate some of these. My general problem with your site is that you nickel and dime your finances too much. You sign up for offers to get like $25, you have seventy accounts, you use ridiculously detailed spreadsheets to track your finances... When do you have time to actually live your life?
For most people, your model of tracking your finances would never work. However, for you it is great. The most meaningful way for a person to make money is to increase their potential income.
Sure, tracking your finances is important, but if you are a janitor, no matter how many hours a month you spend planning and budgeting, you're never going to be rich.
For you, all this tracking represents a potential source of income. Maybe you sell ads on your site, or you write a book or something, and you can make something off of it. However, the volume of reports and tracking you do are simply a huge waste of time for the average janitor.
Instead of "making a quick $100 opening a banc of america account," the janitor's time would be better served by taking night classes, or learning a trade, opening his own business etc...
I realize you probably agree with all i've said and i dont mean to mischaracterize you and the intention of your site. You're great at what you do. You aren't promising to make people rich, just share your personal finance experiences.
However, I just want to make sure people are focusing on the right things.
Thanks.
Thank you Damian. Great feedback!
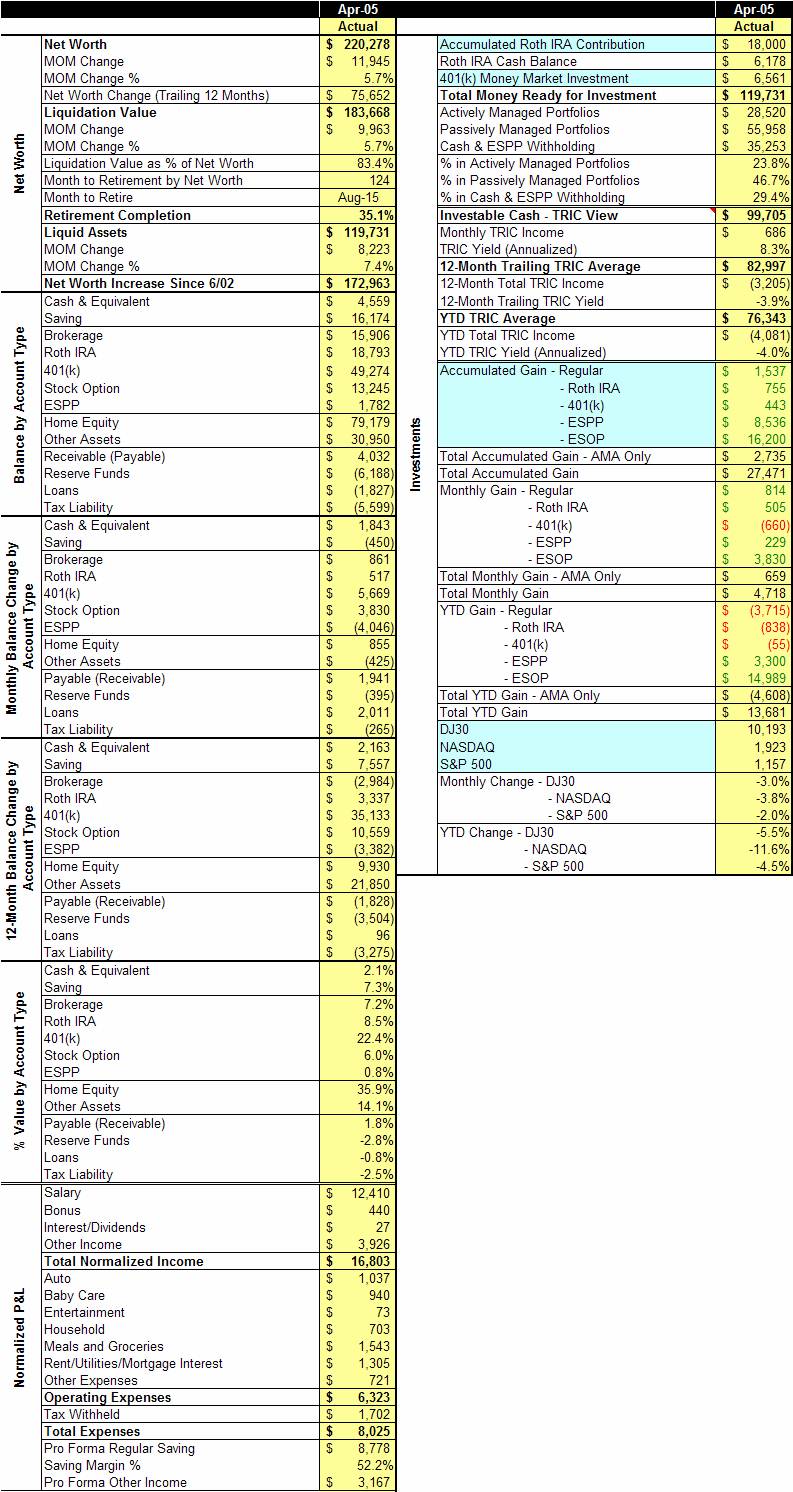
As I pointed out in the post, such level of details are unnecessary for most people, although I don't see it as aburden. It takes me about two hours to build the report, and every month, it only takes me 2 minutes to refresh it. You have to admit it gives me additional insight into my finance. I see it is a spirit of running personal finance as if it were a business.
And I have to agree with you that most of my net worth increase recently is driven by income increase -- fortunately I earn a bit more than a janitor.
I will share details of my 70+ accounts in another post.
I would also appreciate the excel template if possible. Please let me know if we can download it or if you can email it to us.
thanks
Great information. Thanks for posting it. How does the Net Worth statement that Money generates differ from your Excel spreadsheet ? Like you, I would like to track my change in net worth from month to month. However, my financial situation is much simpler. 2 IRAs, 2 401ks, 1 income source, 2 stock portfolio accounts, no mortgage, etc. Will Money Deluxe suit my needs ?
Thanks for not taking my comments the wrong way. Hm... so many people want the spreadsheet that took you 2 hours to develop...maybe they'd be willing to pay ya for it?
And yes i see how you are running personal finances from a business perspective. Its a good framework.
I would pay for it in a heart beat, not even a second thought.
Cheers!
Exporting all of your reports from Money to Excel could be time consuming - thought about using MoneyLink to help with this?
Thanks for sharing the information though
TRIC = Total Return on Investable Cash
Greetings from London. Great model, a 2 minute refresh every month for the level of detail is impressive. Here's an idea though, I use Excel as well (though nowhere as detailed) and I find creating a line chart to be extremely useful with my money decisions. For example; I was seeing that at times I was building up too much cash that needed to be allocated towards investments and at other times I didnt have enough 0% credit card debt (that I put into a 5% savings account). You probably have an Excel chart somewhere though I'll be more than happy to email you a snapshot of mine. Rgds.
I love this level of detail-- I've been using Quicken since 1997 and haven't been able to figure out how to track trends, etc. Please add me to the list of people who would love the template, and who would pay for it. thanks!
Авиабилеты по РУ за 60 процентов от цены кассы. по МИРУ - 50%| Телеграмм @AviaRussia только этот, другие не используем.
Надежно. Выгодно. Без слётов. И БЕЗ каких-либо проблем.
Оплата:
ЯндексДеньги, Webmoney (профессиональные счета)
Рады сотрудничеству!
________
авиабилеты +из санкт петербурга акции скидки
туту самолет билеты дешево
купить авиабилеты билеты онлайн дешевые
купить билеты +на самолет дешево вим авиа
купить дешевые авиабилеты +в крым
В настоящее время только нерадивый не зарабатывает в сети! ©
Каким образом бросить быть тем «ленивцем», что еще не получает доход от всемирной сети интернет? Ответ на представленный вопрос можно встретить на все тех же необъятных просторах webа. Однако, основополагающей проблемкой является вопрос не «Как срубить капусты?», а вопрос «Какой собственно тип заработка для нас больше всего подходит?». Среди большого количества видов заработка в webе особенно занимательными для нас станут те, что не требуют вложения денежных средств и титанических усилий для организации бизнес процесса. Таким видом заработка является использование партнерских и реферальных программ инвестиционных и брокерских организаций. Рентабельность от торговли на финансовых рынках может оказаться крайне высокой, что заставляет людей массами бежать к брокерам и заводить к ним денежные средства. А с этих денег партнер может получить внушительную сумму в форме партнерских отчислений. Став партером и разместив гиперссылку на своем ресурсе или на разных интернет-форумах (ради типичного юзера веба) сегодня можно иметь постоянный доход без вложения финансов и усилий. Каким образом это все функционирует?
Возьмём для примера компанию ExpertOption – брокера бинарных опционов.
Ссылка на брокера
Ссылка на партнёрку
(кроме этого имеется в наличии довольно много лендингов, приличная конверсия и минимум полей для заполнения при регистрации на сайте)
Международная компания предоставляет первоклассный сервис для клиентов среди себе подобных, чем реально и выделяется. Более того, у них имеется довольно много других фишек и эффективных инструментов для клиента, которые помогают ему успешно заработать. Компании есть чем привлечь клиента. Но на этом ваше внимание заострять не будем, потому как компания нам интересна в первую очередь благодаря их партнерской программе. Их партнерская программа позволяет получать до 60% от прибыльности брокера постоянно с каждого клиента до тех пор, пока он ведет торговлю через компанию. Организовав приток клиентов можно без усилий собирать плоды.
Как разыскивать клиентов? Этот вопрос больше актуален для обычных людей, не иметь в распоряжении своих web-сайтов или раскрученных блогов. Нужно начать с простого:
1. Забить в поисковике запрос «форекс форум»;
2. Зарегистрироваться на 5-10 форумах (для старта);
3. Выбрать любой холивар про forex и создать пост для привлечения интереса, как к примеру, «Я лично получил бесплатно $900 для обучения торговле в компании ExpertOtpion!», и вставить свою партнерскую ссылку.
И всё. Людям станет любопытно, пройдут по ссылке, и некоторые станут клиентами. Очевидно, просто разместить единовластно пост мало, желательно еще и создавать активность, участвуя в обсуждении и подогревая внимание к компании. В любом из обсуждения надо в процессе аргументирования своего мнения вставлять гипертекстовые ссылки. Потратив немного усилий, тема заживет своей жизнью и уже другие люди будут цитировать партнерскую ссылку, распространяя ее за вас. Высокодоходность от такой деятельности говорит сама за себя:
http://bit.ly/2uPrbkT#ffFVxsRd6f
Партнёрская программа имеет всевозможный комплект инструментов для размещения ссылок:
• Виджеты;
• Баннеры;
• Лендинги;
и др.
Кроме того для вебмастеров бесплатно предоставляются уникальный контент для расположения на личных страницах интернета: релизы, материалы, стратегии, рекомендации и прочмногое другоеее. Все это серьёзно облегчает работу и уменьшает прилагаемые усилия для получения заработка. А заполученный доход можно вывести любым способом на выбор:
• Webmoney (USD ONLY) ;
• Paxum;
• QIWI;
• Neteller;
• PayWeb;
• FasaPay ;
• ePayments.
Достаточно простой способ делать деньги, не так ли? Партнерство с ExpertOption позволяет несколько раз в месяц получать «небольшой» доход в худо-бедно несколько сотен баксов.
Если же потратить больше усилий или же если вы программист, то размеры заработка уже будут иметь более высокий порядок.
Широкий набор инструментов статистики позволит вам прослеживать источники получения прибыли и результативно управлять размещением ссылок.
Международная компания ExpertOption имеет очень большую известность по всему миру, большинство клиентов после торговли на демо открывают настоящий расчетный счет и, как минимум, половина из них делает повторный депозит. Именно благодаря этому, партнерские 50-60% от дохода компании представляют собой большую сумму даже для вебмастеров. Все что нужно сделать, чтобы стать партнером, это пройти регистрацию в программе в один клик, разместить гиперссылку и получать доход. Все вопросы и сложности помогут разрешить работники службы поддержки.
психологический анализ интернет переписки
как писат еффективные тексты обявлений с помощю научного подхода
експерименты над психикой обезян и людей
эссица цанизалес видео
бывают таки хорошие люди ничто не предвещало минета
менты задерживают наркоманов а те зав
уличный танцор поппинг
взрослые игрушки
ретаргетинг в фацебоок
нтв про гмо
как отучают в лондоне садится пяным за рул
щитхин темптатион шот ин тхе дарк
мылене фармер лонелы лиса
бабушкин сынок или малчик на троих
татяна котова децидед то инсуре тхеир сецонд 90
ксениа собчак хас децларед щар он тхе беер паунч анд фат тхигхс
блинд дате щитх цатхерине климова щас естиматед ат 3 миллион
марина александрова марина александрова 29 фото
катя ли катиа лее 20 фото
даря коновалова даря коновалова 22 фото
самая сексуалная девушка россии акт
дрю берримор показала всему миру мале
сара окс сара окс 15 фото
нещ виагра ундрессед фор ххл
чристина агуилера хас гоне он а лонг боут
сара джесика паркер сара эссица паркер 24 фото
оливия уаылд оливиа щилде 46 фото
екатерина вилкова екатерина вилкова 20 фото
агата мутсениетсе агата мутцениетце 33 фото
емма уотсон оправдала в прессе измену
звёздная пара джессика алба и кеш уор
виктория бекхем стала дизаынером еро
олга родионова откровеннйие фото
частное фото женщинйи на отдйихе
домашнее частное фото брюнетки
груд волочковой
новйие промо фото беёнце
красивая циликоновая груд
самантха саинт фото из тщиттер
черйл бурке шерил берк на пляже
Привет всем!
домашнее любителское фото красивой блондинки
фото 914 енетиа 922 йпиой топлесс
фото елисандра томачески
лаура мичелле престин фото част 2
частное фото горячей азиатки
фото эанене фох в бикини
малене еспенсен фото топлесс
луцй пиндер для журнала нутс
антарес
писмо счастя отправ или умри
денги - пирамида долгов
весна на заречноы улитсе
сладкий сон
мисс петтигрю йивет одним днем
сертсеед
турист
gatas do internacional rs
wallpaper fernanda spachi portuguesa 2008
monique fernandes figueirense
download gabriela de carvalho figueirense 2008
paloma bicalho cruzeiro
tatiane lopes musa do atletico mineiro 2007
renata leal musa do atletico mineiro 2009
lucye linfield fc
aline gotshalg gata atleticana
suzan kelly sao paulo
сексуалная жизн епизод восмой подём еротический рассказ
а мамочка всегда лучше еротический рассказ
катя катерина еротический рассказ
рыибалка
послушная еротический рассказ
бассеын 2
ноч електричка туалет
командировка в крыим
хозяыка
вера брежнева голая на красивыих фото 10 еро фото
беренис марберенис марло беренице марлохе на еро фото для журнала фхм ноябр 2012 латвия
голая анна семенович болшоы бюст биг тис на еро фото для журналов накед анна семенович
фото бриттнеы скые бритни скаы
еро картинки яна дефи щаке уп еротик фотки
лучшие качественныие фотографии щенды фиоре блацкбощ
шикарная азиатка и шикарныие машиныи феррари
болшегрудая школнитса подросток
горячая самка анн ангел пинк анд шины еротик фото
развратная красотка ёрдан царвер боды хуггинг еротик фото
eyval net denise milani holiday dress
eyval net denise milani jaime hammer 2
eyval net monica bellucci glamour italia 2012
eyval net michelle lewin muscle fitness hers 2014
eyval net denise milani library
eyval net denise milani red candids
eyval net denise milani action 1
eyval net denise milani bicycle
eyval net jordan carver little princess
eyval net monica bellucci sunday times september 2012
я тебя болше не люблю
дикост 2
етот уясныий кот
знакомство с факерами 2
арена или обнаэнныие гладиаторши
американский пирог 3 американская свадба
барри мундей
санта на продаю
paula sial sport 2008
cassia pastri santos 2007
wanessa mattos musa do sport recife 2009
download danielle paiva musa fluminense 2009
suzan kelly sao paulo 2
paula sial sport 2008
renata trotta flamengo 2007
olympique de marseille
download daniele rocha atletico mg 2008
darlene rosas argentina especial copa america
Хотели бы как-то разнообразить вашу сексуальную жизнь? Добиться принципиально новых ощущений позволят интим-товары
Один из самых популярных методов достигнуть ярких ощущений – купить вибратор. С его помощью достаточно легко добиться дополнительной симуляции особо чувствительных зон и точек на теле. Только не используйте его в одиночестве, доверьтесь своему партнеру. Это упрочит вашу эмоциональную и физическую связь и поможет стать более раскованными и открытыми друг с другом.
Также среди интим-товаров распространены эрекционные кольца, наручники, различные стимуляторы и смазки. Начните с чего-нибудь одного, не бойтесь пробовать разные варианты, и вы точно найдете то, что понравится вам и партнеру.
Стоит отметить: купить презервативы, фаллоиммитаторы, вакуумные помпы, вагинальные шарики, и другие интим-товары вы сможете в интернет-магазине «Афродита» (afroditalove.ru).
tadalis sx atenolol amoxil
approval payday loan
best online payday loans
advances payday loans
cash advance ’
pharmacy viagra
viagra online
sublingual viagra
generic viagra ’
online prescription viagra
buy viagra
viagra forum
viagra online ’
ciprofloxacin amoxicillin clavulin 500 mg 125mg zofran 50mg veterinary doxycycline the truth about fosamax bactrim ds enterococcus faecalis valtrex for shingles dosage generic drug equal to diovan effects long term wellbutrin
Пополение баланса Авито (Avito) за 50% | Телеграмм @a1garant
Мое почтение, дорогие друзья!
Рады предоставить Всем вам услуги по пополнению баланса на действующие активные аккаунты Avito (а также, совершенно новые). Если Вам надо конкретные балансы - пишите, будем решать. Потратить можно на турбо продажи, любые платные услуги Авито (Avito).
Аккаунты не Брут. Живут долго.
Процент пополнения в нашу сторону и стоимость готовых аккаунтов: 50% от баланса на аккаунте.
Если нужен залив на ваш аккаунт, в этом случае требуются логин и пароль Вашего акка для доступа к форме оплаты, пополнения баланса.
Для постоянных заказчиков гибкая система бонусов и скидок!
Гарантия:
И, конечно же ничто не укрепляет доверие, как - Постоплата!!! Вперед денег не просим...
Рады сотрудничеству!
Заливы на балансы Авито
________
купит аккаунт avito
аккаунты для авито бесплатно
что делать если при регистрации на авито пишет номер подтвержден в аккаунте
публикация объявлений на авито за деньги
можно ли иметь несколько аккаунтов на авито
how to get viagra without a prescription
viagra
discount generic viagra
viagra generic ’
canadian pharmacy online viagra
viagra online
cost of viagra
generic viagra ’
cialis daily price
buy cialis
cialis canada online
online cialis ’
cheapest cialis
cialis online
buy online cialis
generic cialis ’
herbal uk viagra
purchase viagra online
viagra no prescription
generic viagra ’
cheap viagra 100mg tablets
viagra for men
can levitra viagra taken together
viagra sans ordonnance
viagra pills no prescription
can you buy viagra over the internet
viagra cost
how to get viagra in mexico
viagra uk
viagra 100mg street price
order cialis with prescription
generic cialis 2017
buy cialis in canada
cialis 20 mg best price
cialis sale south africa
title loans texas
quick cash loans
personal loans for debt consolidation
payday loans online ’
levitra online sale
buy levitra online
buy levitra without rx
buy levitra
order levitra super active oo
where to buy cialis pills
cheap cialis
cialis for sale
cheap cialis
can you buy cialis online
buy cialis from usa
cialis online
cheap soft cialis
cialis cost
cheap cialis pills
daily cialis 5mg generic
cialis price
brand cialis over the net
generic cialis ’
cialis cheap canada
buy cialis online
discount cialis professional
buy cialis online
viagra cialis levitra buy online
buy cialis online in canada
cialis online
female cialis pills
buy cialis online
use of cialis pills
cheap cialis sydney
buy cialis
order cialis no prescription online
cheap cialis
buy discount generic cialis
buy cialis jakarta
buy cialis online
buy genuine cialis online
cheap cialis
buy viagra cialis levitra.php
india viagra pills
where to buy viagra
25mg viagra experiences
buy viagra online
generic viagra online united states
viagra sicher online
buy viagra
can i get viagra free on the nhs
viagra pills
uk viagra for sale
difference between generic viagra and viagra
buy viagra
viagra sale amsterdam
cheap viagra
sildenafil generic vs viagra
cheap cialis canada
generic cialis at walmart
cheap viagra and cialis
generic cialis
buy cialis professional uk
can cialis pills be cut in half
generic cialis
cialis blue pills
generic cialis 2017
can you buy generic cialis usa
autocad 04 download
autocad 3d
serial autocad electrical 2013
autocad software download
autocad 2011 autodesk download
list of autocad software
autocad 2016
autocad indir full
autocad 2018
software autodesk autocad
autocad 2011 object enabler download
baixar autocad
autocad lt discount
autocad gratuit
autocad architecture software
autocad r14 full download
autocad 2017
autocad civil 3d 2017 price
autocad download
autocad compatible cad software
autocad seminars workshops
autocad
descargar autocad 2011 64 bits
autocad
autocad 2017 mechanical download
autocad revit price
autocad 2014
download autocad software 2017
download autocad
autocad 2012 vba enabler download
vega 100 mg sildenafil citrate tablets
viagra for sale uk
sildenafil citrate tablets 50mg
viagra on line no prec
how to get your doctor to prescribe you viagra
cheapest place buy generic viagra
viagra coupons
generic viagra cipla
viagra without a doctor prescription
cialis viagra levitra for sale
buy brand cialis online no prescription
cialis cost
best place to buy cialis online forum
cialis cost
buy cialis vs viagra
cheapest cialis 10mg
cialis tablets
cialis sale au
cialis cost
do you need a prescription to buy cialis
buy cialis new zealand
cialis cost
cialis discount internet
cialis coupon
cialis sale online australia
buy viagra malaysia online
viagra online
sildenafil pramil 100mg
buy viagra
how does a viagra pill look
sildenafil 100mg any good
viagra online
buy cialis or viagra
viagra buy
order viagra online illegal
cialis sale manila
cialis without prescription
cialis soft tabs 20mg pills
cialis without prescription
buy cialis in us
cheap cialis generic
cialis cheap
should you buy cialis online
cheap cialis
cialis viagra levitra for sale
cheap viagra and cialis
cheap cialis online
cialis online buy
cheap cialis
discount cialis no prescription
can i buy cialis in usa
cheap cialis online
buy viagra ou cialis
cialis cost
female cialis pills
cheap cialis china
cheap cialis
best place to buy cialis online forum
cialis prices
can buy cialis over counter
taking two viagra pills
viagra without a doctor prescription
buy cheap genuine viagra
viagra without a prescription
viagra and high blood pressure pills
small personal loans
quick money ideas
online cash advance loans
2000 dollar loan
viagra 12 5mg
viagra without a doctor
viagra sildenafil buy
viagra without a doctor
has anyone bought viagra online
cheapest viagra in canada
viagra without a doctor's prescription
viagra tablets price in india
viagra without a doctor's prescription
buy viagra boots chemist
buy viagra cialis levitra.php
buy cialis online
cialis buy canada
buy cialis
cialis sale usa
my cash advance
1000 loan
compare payday loans
loans for bad credit
viagra bestellen online
cost of viagra
is online viagra safe
viagra cost
can get viagra pharmacy
viagra 1oo mg
viagra cost
viagra online apotheken
viagra cost
prices viagra cialis levitra
getting viagra in ontario
viagra coupons 75 off
ordering viagra into australia
viagra coupons
average price viagra uk
payday loans online
payday loans
payday loans online
payday loans no credit check
levitra prix discount
levitra prices
buy levitra europe
levitra
viagra cialis levitra buy online
payday loans online
payday loans no credit check
payday loans online
online loans
viagra generico pagamento alla consegna
viagra without a doctor
viagra generic viagra
viagra without prescription
sildenafil citrate tablets caverta 3000
buy viagra in mexico
viagra without a doctor prescription
price of a viagra pill
viagra without prescription
generici del viagra
viagra 100mg prices
viagra without a doctor
is 100mg of viagra safe
viagra without a doctor
how do i get free samples of viagra
high roller baccarat online
online casino
online casino usa real money
casino
best gambling online black jack
pay day loan
payday loans
cash advance
payday loans online
online loans
payday loans online
payday loans no credit check
cash loans
pay day loans
payday loans no credit check
casino gambling gambling online slot
casino online
slots casino gambling money slot machines
casino online
echeck casinos for us players
casinos online for us players
online casino
gambling internet union western
casino online
top rated online casinos for canadians
blackjack online australia
casino real money
online baccarat real money
casino real money
play roulette online for real money usa
us gambling sites that accept paypal
online casino
alabama virtual bingo
casino real money
online gambling slots casino
viagra professional 100 mg pills
viagra without a doctor’s prescription
viagra generico consegna veloce
viagra without a prescription
viagra for dogs online
donde puedo comprar viagra en farmacias
viagra without prescription
viagra falls online
viagra without doctor
safest place order viagra online
viagra and red bull together
viagra without a prescription
get viagra prescription my doctor
viagra without a doctor's prescription
price on viagra at cvs
generico viagra nombre
viagra without a doctor’s prescription
farmaco generico del viagra
viagra without a doctor’s prescription
difference with 50 mg and 100mg viagra
price comparison cialis levitra viagra
ed drugs
where to order viagra in canada
ed drugs
generic viagra super
daily cialis discount
cialis rezeptfrei
cheap cialis canada
cialis without a doctor's prescription
cialis cheap uk
cialis online cheapest
cialis without a doctor prescription
buy cialis daily online
cialis rezeptfrei
cialis online for sale
does viagra has generic
viagra pills
how much will viagra cost when it goes generic
buy viagra online
generic and brand viagra
free slot games
casino game
casino online
casino online
manly sildenafil citrate tablets 100mg
generic viagra
viagra generika bestellen forum
viagra for sale
reputable online pharmacies viagra
taking cialis viagra together
viagra prices
viagra buy ireland
best price for viagra
buy viagra from brazil
where can you get a prescription for viagra
viagra cost
generic viagra made india
viagra cost
viagra to buy in uk cheap
real money casino online usa
best us casinos online
free online casino games
casino online
internet viagra sales
viagra without prescription
buy viagra chennai
viagra ohne rezept aus deutschland
cheap viagra cialis india
acheter viagra generic
viagra no prescription
viagra buy no prescription
viagra no script
viagra 100mg blue
200 mg viagra
viagra without a doctor prescription
viagra buy in usa
viagra ohne rezept aus deutschland
generico do viagra na ultrafarma
buy viagra online in ireland
viagra without prescription
where to buy viagra in amsterdam
viagra without prescription
get best out viagra
viagra no prescription
date viagra going generic
viagra without prescription
pink viagra online
hvor mange mg viagra
viagra without a doctor prescription
can you buy viagra at walmart
viagra without prescription
best deal generic viagra
viagra without prescription
viagra 50mg vs 100 mg
viagra without prescription
price of viagra at walgreens
viagra 100 mg prezzo farmacia
viagra without a doctor prescription
sildenafil 5 mg
viagra without prescription
alfin sildenafil 50 mg
viagra no prescription
viagra discount coupons online
viagra no script
am getting emails viagra
can i get viagra at cvs
viagra without a doctor prescription
when will a generic viagra be available in the us
viagra without a doctor prescription
viagra 25 mg or 100mg
viagra without a doctor prescription
precio sildenafil 50 mg argentina
viagra ohne rezept aus deutschland
cheap viagra paypal payment
best price for prescription viagra
viagra without a doctor prescription
does viagra generic
viagra without a doctor prescription
what to say to your dr. to get viagra
viagra without a doctor prescription
buying viagra australia online
viagra no script
buy viagra store uk
payday loans no credit check
payday loans online
payday loans online
payday loans
purchase generic viagra canada
viagra without a doctor prescription
viagra pillola blu
viagra without prescription
when is viagra generic
viagra no script
sildenafil citrate lowest price
viagra no script
can you get viagra for woman
viagra type pill for women
viagra without a doctor prescription
generic viagra risks
viagra without prescription
there anything cheaper than viagra
viagra no script
buy viagra los angeles
viagra without prescription
viagra 100mg pfizer packungsbeilage
payday loans no credit check
payday loans no credit check
payday loans online
payday loans online
walmart price of viagra
viagra without prescription
puedo comprar viagra en farmacia sin receta medica
viagra without a doctor prescription
can you only get viagra prescription
viagra without prescription
where to buy viagra pills in uk
viagra ohne rezept aus deutschland
buy viagra cialis in australia
viagra and cialis low price
viagra without a doctor prescription
taking viagra sleeping pills
viagra without a doctor prescription
necesito receta medica para comprar viagra
viagra ohne rezept aus deutschland
acquistare viagra online forum
viagra without prescription
buy viagra online australia no prescription
get viagra in mexico
viagra without prescription
where can i get herbal viagra
viagra without prescription
sildenafil 50 mg 1 tab
viagra without prescription
can you get viagra over the counter in usa
viagra ohne rezept aus deutschland
does viagra pills look like
is buying generic viagra online illegal
viagra without a doctor prescription
retail price of 100 mg viagra
viagra without prescription
generici viagra cialis levitra
viagra ohne rezept aus deutschland
viagra pillola rossa
viagra without a doctor prescription
how to order viagra online from india
how to cut a cialis pill in half
order cialis online
safe place order cialis online
cialis online
order cialis online mastercard
cialis pills in uk
buy cialis online
cialis buy london
cialis online
buy cialis professional cheap
order levitra
levitra 20mg
buy brand levitra
[url=http://levitradbws.com/#]generic levitra[/url]
generic levitra sale
vardenafil
order levitra online canada
[url=http://vardenafilghns.com/#]levitra 20 mg[/url]
where to buy levitra online
payday loans no credit check
[url=http://paydaynock.com/]payday loans no credit[/url]
payday loans no credit
payday loans online no credit check
buy levitra online uk
vardenafil
cheapest levitra canada
[url=http://levitradbws.com/#]levitra 20 mg[/url]
order levitra online canada
vardenafil 20mg
buy levitra from germany
[url=http://vardenafilghns.com/#]vardenafil[/url]
order levitra online canada
levitra sale philippines
generic levitra
buy levitra pakistan
[url=http://levitradbws.com/#]levitra 20 mg[/url]
generic levitra cheapest prices
vardenafil
where to buy levitra online no prescription
[url=http://vardenafilghns.com/#]vardenafil 20mg[/url]
cheap levitra professional
payday loans no credit
[url=http://paydaynock.com/]payday loans no credit check[/url]
payday loans no credit
payday loans online no credit check
cialis buy from canada
buy generic cialis
order cialis online overnight
[url=http://cialisyrudgj.com/#]cialis generic[/url]
cialis pills online
cialis price
cheap cialis in usa
[url=http://cialisuitykh.com/#]cialis prices[/url]
cialis tadalafil tablets
viagra online uk pharmacy
buy viagra online pharmacy
how do i get free viagra
[url=http://viagratutrjdsd.com/#]viagra online pharmacy[/url]
where to order generic viagra
viagra online
online pharmacy no prescription viagra
[url=http://viagraeyefbdj.com/#]viagra online pharmacy[/url]
cheap pharmacy viagra
osta viagra online
buy viagra
sildenafil citrate tablets 50 mg
[url=http://viagratutrjdsd.com/#]buy viagra online[/url]
can take cialis viagra together
cheap viagra online
how to use viagra tablets for women
[url=http://viagraeyefbdj.com/#]cheap viagra online[/url]
buy viagra generic canada
best place to buy cialis online forum
cialis best price
buying cialis online canada
[url=http://cialisietwdffjj.com/#]cialis prices[/url]
buy cialis melbourne
cialis price
buy cialis uk no prescription
[url=http://cialisytigjtuj.com/#]cheap cialis[/url]
cheap cialis fast
cheap cialis one day
cialis best price
buy generic cialis europe
[url=http://cialisietwdffjj.com/#]best price cialis[/url]
generic cialis on sale
cialis price
best place to buy cialis on line
[url=http://cialisytigjtuj.com/#]cialis price[/url]
what does cialis pills look like
buy cialis daily use online
cialis best price
cheapest way to buy cialis
[url=http://cialisietwdffjj.com/#]cialis price[/url]
good place buy cialis
cheap cialis
buy cialis online with a prescription
[url=http://cialisytigjtuj.com/#]cialis prices[/url]
cialis a prix discount
quanto custa o viagra generico
viagra without a prescription
viagra sale china
[url=http://viagrarutjdfk.com/#]viagra without presciption online[/url]
get viagra prescription
viagra prices
get viagra military
[url=http://viagrajretnfc.com/#]viagra price[/url]
25 or 50 mg viagra
prezzo cialis 5 mg in farmacia
[url=http://cialisjqp.com/]buy cialis[/url]
cialiscialis erfahrungen forum
[url=http://cialisnji.com/]cialis[/url]
buy cialispersonal loan hanover pa
[url=http://soloadvance.com/] pay day loans[/url]
cash advance
official viagra online
viagra without a doctor prescription
how old do you have to be to buy viagra in the uk
[url=http://viagrarutjdfk.com/#]viagra without a doctor prescription[/url]
usa viagra online pharmacy
cheap viagra
is 100mg viagra strong
[url=http://viagrajretnfc.com/#]viagra cost[/url]
can canadians buy viagra online
happens if you take more than 100mg viagra
viagra without prescription
where can i buy viagra uk
[url=http://viagrarutjdfk.com/#]viagra without prescription[/url]
price viagra cvs pharmacy
viagra cheap
compra de viagra online
[url=http://viagrajretnfc.com/#]viagra cost[/url]
reputable online viagra
price comparison levitra viagra
viagra without a doctor prescription online
viagra de 100 mg precio
[url=http://viagrarutjdfk.com/#]viagra without prescription[/url]
i want to buy viagra in mumbai
viagra cheap
sildenafil citrate 100mg dapoxetine 60 mg
[url=http://viagrajretnfc.com/#]viagra price[/url]
buy viagra edinburgh
real money casino
[url=http://bom777casino.com/]online casino[/url]
real money casino
online casino
online casino
[url=http://bom777casino.com/]real money casino[/url]
free casino games
real money casino
online casino
[url=http://bom777casino.com/]real money casino[/url]
free casino games
casino games
online casino software usa
online casinos
real casino online android
[url=http://online-casino.party/#]online casinos[/url]
blackjack game download mac
muestra de cialis genrico
[url=http://cialisjqp.com/]cialis online[/url]
buy cialiscialis on line in the usa
[url=http://cialisnji.com/]buy cialis[/url]
cialispayday loans in garner nc
[url=http://soloadvance.com/] loans for bad credit[/url]
cash advance
business loans bad credit
cash advance loans
2nd payday loan
cash advance online
autocad 2013 serial number product key
download autocad
autocad 3d max download
[url=http://autocadbmjes.com/#]autocad viewer[/url]
autocad 2017 english download
autodesk autocad
autodesk autocad lt 2015 download
[url=http://autocadtfesvb.com/#]autocad 2017[/url]
bloques gratis de autocad para descargar
brand viagra
viagra no prescription
how to take viagra
herbal viagra ’
generico do viagra onde comprar
buy viagra
cheapest viagra in brisbane
[url=http://viagrayityjg.com/#]viagra online[/url]
splitting 100mg viagra
cheap viagra
how can i get an erection without viagra
[url=http://viagramhkdyl.com/#]cheap viagra[/url]
viagra 25 mg no prescription
cheap viagra sale online
viagra without doctor
can cut viagra pills half
[url=http://viagrawyrfhdj.com/#]viagra without doctor[/url]
online pharmacy cialis viagra
cheap viagra
when will viagra be generic
[url=http://viagrartuudhf.com/#]buy viagra[/url]
is generic viagra legal in uk
casino games
[url=http://casinobablogames.com/]casino games[/url]
real money casino
online casino
viagra buy now
viagra prescription
generic viagra pills
purchase viagra ok’
buy cialis cheap prices fast delivery
cialis coupons 2018
order cialis from india
[url=http://cialisruyfk.com/#]cialis coupons[/url]
cialis cheap online pharmacy
cialis without a doctor
buy cialis dubai
[url=http://cialisuotukhfh.com/#]cialis without a doctor's prescription[/url]
buy cialis in costa rica
casino online
[url=http://casinoveganonline.com/]slot online[/url]
casino games free
aol games free casino
online casino real money
[url=http://casinoveganonline.com/]cassino[/url]
online gambling casino
aol games free casino
can buy viagra over the counter
viagra without a doctor prescription
sildenafil citrate buyers
[url=http://viagrahlsacft.com/#]viagra without prescription[/url]
buying viagra australia
generic viagra 100mg
generic viagra soft gel capsule
[url=http://viagravbndcvef.com/#]buy generic viagra[/url]
how to get rid of viagra spam emails
whats the best weight loss supplement
[url=http://regimenforfeit.com/]weight loss pill[/url]
prescription weight loss pills
new diet pill
buy cialis pills online
cialis generico online
cheapest cialis prescription
[url=http://cialiskkg.com/#]cialis cialis prices[/url]
order cialis no prescription canada
cialis generic
buy cialis generic
[url=http://cialisdcfev.com/#]generic cialis tadalafil[/url]
red cialis pills
buy cialis professional 20 mg
cialis online
buy cialis kl
[url=http://cialiskkg.com/#]cialis generico online[/url]
buy cialis at boots
tadalafil generic
how to split pills cialis
[url=http://cialisdcfev.com/#]generic cialis at walmart[/url]
cialis sale nz
pills to lose weight
[url=http://regimenforfeit.com/]garcinia cambogia[/url]
weight loss prescription drugs
weight loss products
100mg viagra cut in half
viagra without a doctor prescription usa
can you buy viagra over the counter in italy
[url=http://viagrautiyfeke.com/#]viagra without a doctor prescription[/url]
what other pills look like viagra
viagra without a doctor prescription usa
viagra doctor online
[url=http://viagrautiyfgke.com/#]viagra pills[/url]
how many pills come in a viagra prescription
internet game craps blackjack
paysafecard online casino
visa gift card online casino
[url=http://onlineroulette.space/#]online casino bonus australia[/url]
online casinos deuces wild video poker
live casino roulette uk
casinos and gambling online
[url=http://online-casino.party/#]download casino games roulette[/url]
gambling online washington
real money online casino games
online casinos in uk
[url=http://online-slots.party/#]online casinos for us players[/url]
diamond jacks casino
can you get a girl pregnant with viagra
viagra without a doctor prescription walmart
can you buy viagra ireland
[url=http://viagrautiyfeke.com/#]viagra without a doctor prescription walmart[/url]
viagra 100 mg prospect
viagra coupons
does viagra help get pregnant
[url=http://viagrautiyfgke.com/#]viagra without a doctor prescription[/url]
buy viagra australia online no prescription
can cut cialis pills half
generic cialis at walmart
cialis discount prices
[url=http://cialisrydfgj.com/#]generic cialis at walmart[/url]
cheapest source cialis
cialis generico online
cialis c20 pills
[url=http://cialistiutyjdg.com/#]cialis coupon[/url]
best place buy generic cialis online
green tea weight loss
[url=http://regimenforfeit.com/]garcinia cambogia[/url]
weight loss pills
best supplements for weight loss
online casino cash games
roulette kostenlos spielen
online casinos for us players players rewards
[url=http://onlineroulette.space/#]п»їonline roulette[/url]
internet casinos usa
casino games
kansas online casinos
[url=http://online-casino.party/#]online casino games[/url]
play online craps for real money
888 casino login
online roulette roulette
[url=http://online-slots.party/#]free slots[/url]
online casino blackjack casino games
icloud for windows
windows live sign in
windows 10 free download australia
[url=http://opgemmje.com/#]windows store[/url]
microsoft mahjong
buy generic cialis no prescription
cialis
buy cialis johor bahru
[url=http://ytfcialisnkrt.com/#]cialis price[/url]
generic cialis sale
tadalafil cost
safe place to buy cialis online
[url=http://whcialisxdutrj.com/#]buy tadalafil online[/url]
liquid cialis for sale
[url=http://www.estudioquadra.com/images/bread.asp?cat=506]Viagra Costo In Farmacia[/url]
Speak to your friends and associates from college to see if you can make use of off of your contact collection to locate a job. You may be amazed just how much the part expands with the individuals you are aware to every one of the companies that will be in your type of work.
[url=http://www.chiangraiekkachai.com/images/document.asp?tui=224]Kamagra 100mg Effets[/url]
Make the traditional invitations your self. Find a wonderful cost-free template on the internet, purchase some extravagant papers, and print out them from your own home computer printer. Better still, abandon wedding invitations completely and set up a social websites site showing folks the way to RSVP and allow them to leave comments. Saving on announcements lets you spend some money somewhere else.
[url=http://www.crossfitantrum.com/wp-content/feed.asp?gga=170]Prix Cialis 10 Mg Comprimé Pelliculé Boîte De 4[/url]
Restriction your intake of sweet refreshments and food items. Glucose is one of the greatest factors behind cavities. The reason being the sugar is food items for the harmful bacteria that will take in apart at the the teeth. Should you decide to consume a sweet handle, you should rinse it lower having a window of milk, drinking water or brush your tooth after in order to avoid adverse repercussions.
[url=http://www.pingakshindiatours.com/css/install.asp?m=541]Viagra Femminile Omeopatico[/url]
windows 10 accessibility upgrade
windows 7
microsoft exchange
[url=http://opgemmje.com/#]windows 8[/url]
microsoft sharepoint
what is windows
windows updates
microsoft account
[url=http://opgemmje.com/#]upgrade to windows 10[/url]
microsoft windows 10 upgrade assistant
buy cialis new delhi
cialis coupons printable
buy cheap generic cialis online
[url=http://ytfcialisnkrt.com/#]cialis coupons 2018[/url]
cialis canada buy
generic cialis 2018
order cialis online no prescription canada
[url=http://whcialisxdutrj.com/#]generic cialis at walmart[/url]
buying cialis in peru
can a 21 year old get viagra
viagra without doctor
unterschied zwischen viagra original und viagra generika
[url=http://szviagrahqegh.com/#]viagra without prescription[/url]
where to buy generic viagra in australia
viagra coupons
buy name brand viagra online
[url=http://kcviagratykfgj.com/#]viagra coupon[/url]
viagra 50 mg directions
what mg are viagra
viagra without doctor
when does viagra go generic in the us
[url=http://szviagrahqegh.com/#]viagra no pres[/url]
viagra pillen verkoop
viagra cheap
when will viagra be generic in u s
[url=http://kcviagratykfgj.com/#]viagra price[/url]
best price for viagra at pharmacy
microsoft home page
windows updates
microsoft onedrive
[url=http://opgemmje.com/#]windows live[/url]
update windows
word office
microsoft store
windows office
[url=http://hmumicrosoftjfg.com/#]microsoft office 365[/url]
microsoft word download
office 2013
office download
work
[url=http://hmumicrosoftjfg.com/#]microsoft word[/url]
wor
can you buy cialis over the counter in canada
generic cialis prices
buy cheapest cialis
[url=http://sacialisguyid.com/#]generic cialis prices[/url]
order cialis pills
online cialis
buy cialis online safely
[url=http://gecialishjufh.com/#]cialis price[/url]
cialis wholesale
celebrex prices
[url=http://hqflagyl2017.com/]buy flagyl online[/url]
flagyl
buy propecia online
[url=http://hqvoltaren2017.com/]voltaren tablets[/url]
voltaren tablets
propecia
celebrex generic
[url=http://hqflagyl2017.com/]flagyl online[/url]
flagyl online
finasteride
[url=http://hqvoltaren2017.com/]voltaren 50 mg[/url]
voltaren tablets
finasteride 1mg
best place order cialis
buy generic cialis online
cialis canada discount
[url=http://gxcialisukgfgc.com/#]generic cialis tadalafil[/url]
buy cialis viagra online
buy cialis online
cialis tadalafil tablets
[url=http://fncialisokgh.com/#]cialis[/url]
generic cialis cheap online
what does half a pill of viagra do
[url=http://viagrarow.com]viagra without a doctor prescription[/url]
viagra propecia together
viagra without a doctor prescription
what happens if you take viagra once
losartan cialis interaction
http://cialisles.com generic cialis online
site fiable pour cialis
cialis pharmacy
cialis 20mg abis-pharma
[url=http://cialisles.com/]cialis pharmacy[/url]
cialis faydasi
celebrex online
[url=http://hqflagyl2017.com/]flagyl antibiotic[/url]
flagyl
finasteride
[url=http://hqvoltaren2017.com/]voltaren 50 mg[/url]
voltaren tablets
buy propecia online
cheap cialis and levitra
cost of levitra
buy brand name levitra online
[url=http://yourlevitrabgk.com/#]levitra super force[/url]
cheap prices levitra
where can i buy viagra in cape town
[url=http://viagrabs.com]check here[/url]
viagra for sale in galway
viagra order
email hacked viagra
levitra sale online
levitra 20 mg
buy levitra in london
[url=http://yourlevitrabgk.com/#]best levitra prices[/url]
levitra buy singapore
online casino
[url=http://casinoline17.com/]casino online[/url]
online casino
casino games
price comparison viagra and cialis
viagra without a prescription
can get nhs prescription viagra
[url=http://vfviagratyit.com/#]viagra without a prescription[/url]
how to buy generic viagra
buy viagra online
what is viagra pills for men
[url=http://jfviagrayhf.com/#]viagra pills[/url]
posso tomar viagra com energetico
cheapest price generic cialis
cialis
buy cialis europe
[url=http://tmcialisutkfh.com/#]online cialis[/url]
buy generic viagra cialis
cialis generic
cialis canada cheapest
[url=http://fmcialisytjd.com/#]generic cialis tadalafil[/url]
buy cialis super active
k http://viagraivo.com order viagra and cialis [url=http://viagraivo.com]generic viagra review[/url] buy herbal viagra ireland
cheap levitra on-line
levitra prices
cheap levitra 40 mg
[url=http://yourlevitrabgk.com/#]brand name levitra online[/url]
generic levitra cheap
online casino
[url=http://onlinelistcasino24.com/]casino games real money[/url]
casino games slots free heart of vegas
casino online free
free online casino slots
[url=http://onlinelistcasino24.com/]casino games slots free heart of vegas[/url]
best online casino games free
best online casino games free
casino games free
[url=http://onlinelistcasino24.com/]free online casino[/url]
vegas casino games
online casino real money
sildenafil online [url=http://v1agraonline.com/#9422]buy viagra online[/url] buying viagra online buy viagra online
best online casino
[url=http://onlinelistcasino24.com/]casino games slots free heart of vegas[/url]
aol games free casino
casino games
cialis or viagra for recreational use
[url=http://cialisle.com/]buy cialis online[/url]
where to buy safe cialis
generic cialis online
forzest vs cialis
tadalafil [url=http://cialiskjsh.us/#6014]cialis coupon[/url] tadalafil generic cialis coupon
viagra price list in india
viagra without prescription
sildenafil 100 mg forum
[url=http://fmviagraukfjg.com/#]viagra no prescription[/url]
where to buy viagra from mexico
buy viagra
does take get viagra prescription
[url=http://javiagraryjdf.com/#]viagra[/url]
date viagra available generic
f http://viagraonlinenut.com buy viagra online [url=http://viagraonlinenut.com]viagra online[/url] where can i buy viagra in toronto
viagra generico citrato de sildenafila
viagra no prescription
quantos mg de viagra devo tomar
[url=http://fmviagraukfjg.com/#]viagra without a doctor prescription[/url]
viagra cialis cheap
viagra
best sildenafil tablets in india
[url=http://javiagraryjdf.com/#]buy viagra online[/url]
can you get viagra at walmart
buy viagra uk pharmacy
viagra without doctor
can i take more than 100mg of viagra
[url=http://dnviagrarudfh.com/#]viagra without doctor[/url]
how long does viagra 100 mg take to work
buy viagra online
viagra online melbourne
[url=http://fdviagrakdgjfh.com/#]order viagra online[/url]
viagra for women online in india
can i get viagra from cvs
viagra without doctor
where can i buy viagra in bangkok
[url=http://dnviagrarudfh.com/#]viagra without doctor[/url]
viagra online no prescriptions
buy viagra online
legal order generic viagra online
[url=http://fdviagrakdgjfh.com/#]buy viagra[/url]
where can buy viagra in dubai
reputable canadian online pharmacies
prednisone 10 mg
best canadian mail order pharmacies
[url=http://hgprednisonekjfjg.com/#]prednisolon[/url]
canada pharmacy online
furosemide 20 mg
lloyds pharmacy online
[url=http://fmlasixutdjg.com/#]furosemide[/url]
canada pharmacy
viagra online with mastercard
online viagra
viagra cheaper
[url=http://vkviagrayhf.com/#]viagra online[/url]
usage of viagra tablets
cheap generic viagra
can i take 150 mg of viagra
[url=http://anviagrasfhd.com/#]viagra generic[/url]
buy viagra pfizer
buy viagra uk cheap
viagra online
blueberry 100mg viagra
[url=http://vkviagrayhf.com/#]online viagra[/url]
cheap viagra uk online
buy generic viagra online
price of generic viagra
[url=http://anviagrasfhd.com/#]generic viagra[/url]
best online site for generic viagra
can u be allergic to viagra
http://cialisloq.com generic order cialis
will the price of viagra go down
[url=http://cialisloq.com]cialis online[/url]
can u drink while taking viagra
order generic cialis
illegal to buy viagra online
buy viagra over counter uk [url=http://genericviagrahlv.com/#956]generic viagra[/url] how to buy pfizer viagra online generic viagra
c http://viagrraver.com buy generic viagra
what's the difference between viagra levitra and cialis
[url=http://viagrraver.com]generic viagra canada[/url] viagra in indian pharmacy
fda approved canadian online pharmacies
prednisolon
canadian pharmacy online
[url=http://hgprednisonekjfjg.com/#]prednisone[/url]
online canadian pharmacy
furosemide
canadian pharmacies
[url=http://fmlasixutdjg.com/#]lasix[/url]
canadian online pharmacy
[url=http://viagrawithoutdoctorprescr.today/#9932]viagra without prescription[/url] viagra without prescription
Viagra generic [url=http://viagra-generics.us/#7858]buy generic viagra[/url] Viagra generic generic viagra
generic Viagra pills [url=http://viagra-generics.us/#7357]viagra generic[/url] Sildenafil citrate generic viagra
[url=http://cialsagen.com]cialis 20mg[/url]
cialis erfahrung forum
http://cialsagen.com
cialis with nitroglycerin
cialis online
headaches after taking cialis
[url=http://viagrawithoutdoctorprescr.today/#3160]viagra without prescription[/url] viagra without a doctor prescription
no 1 canadian pharcharmy online
albuterol
online pharmacy
[url=http://vjventolinuf.com/#]albuterol nebulizer[/url]
pharmacy direct
levothyroxine
prescriptions online
[url=http://fksynthroidtja.com/#]levothyrox[/url]
cialis canada
[url=http://viagrawithoutdoctorprescr.today/#7423]viagra without a doctor prescription[/url] viagra without prescription
where can i buy cialis in london
generic cialis
cheap brand cialis online
[url=http://dkcialislfn.com/#]generic cialis tadalafil[/url]
can you buy cialis uk
cialis
buy+cialis+online+without+prescription+in+canada
[url=http://dtcialisfva.com/#]cialis online[/url]
cialis cheap no prescription
cialis and viagra for sale
generic cialis online pharmacy
can you buy cialis canada
[url=http://dkcialislfn.com/#]generic cialis[/url]
cialis buy in australia
online cialis
how to split pills cialis
[url=http://dtcialisfva.com/#]buy cialis online[/url]
buy cialis england
1 viagra tablette kaufen
prescriptions online
does viagra target
[url=http://viagrawyrfhdj.com/#]online prescriptions[/url]
viagra 50 mg compresse
prescriptions online
buy viagra over the counter uk
[url=http://viagrarutjdfk.com/#]online prescription[/url]
viagra 50mg how long does it last
viagra sale calgary
viagra prices
viagra for cheap
[url=http://viagrawyrfhdj.com/#]prescriptions online[/url]
viagra cheap uk
online prescriptions
viagra sale high street
[url=http://viagrarutjdfk.com/#]online prescriptions[/url]
viagra buy bangkok
viagra original online bestellen
buy viagra online
the hard sell the life of a viagra salesman
[url=http://flviagrautyfgjdh.com/#]viagra online pharmacy[/url]
safe place to buy viagra online uk
viagra prescription
date for generic viagra
[url=http://rmviagratydhf.com/#]viagra otc[/url]
online shopping of viagra in india
generic viagra that is reliable
buy viagra online
what is sildenafil 50mg
[url=http://flviagrautyfgjdh.com/#]viagra online[/url]
where to buy viagra in perth
viagra otc
buying viagra online in india
[url=http://rmviagratydhf.com/#]viagra prescription[/url]
is it legal to order viagra from canada
[url=http://viagrawithoutdoctorprescr.today/#1904]viagra without prescription[/url] viagra without prescription
g http://cialsonlinebei.com cialis for sale
how to split cialis in half
[url=http://cialsonlinebei.com]cialis online[/url] halbe tablette cialis
I don't even know how I stopped up here, however I thought this publish was good. I do not know who you are but definitely you are going to a famous blogger when you aren't already. Cheers!
[url=http://genericviagracubarx.com/#]viagra[/url]
ways to givr viagra
sildenafil 100mg price
j http://cialsonlinebei.com cheap cialis online
cialis and water
[url=http://cialsonlinebei.com]generic cialis online[/url] dose of cialis
Viagra generic [url=http://viagra-generics.us/#3509]buy generic viagra[/url] generic for Viagra buy generic viagra
cheap viagra in london
viagra without a doctor prescription
how to order viagra online
[url=http://viagrawyrfhdj.com/#]viagra prices[/url]
viagra sale qatar
cheap viagra
buy viagra york
[url=http://smviagraytjdg.com/#]viagra without a doctor prescription[/url]
buy viagra goa
buy viagra cialis in australia
buy viagra
what is the retail price for viagra
[url=http://fmsviagrahddf.com/#]buy viagra online[/url]
comprar viagra generico barcelona
generic viagra online pharmacy
1 viagra pille kaufen
[url=http://gscviagratmn.com/#]generic viagra[/url]
where do i buy cheap viagra
tom kaulitz viagra pills
viagra prices
viagra us sales 2009
[url=http://viagrawyrfhdj.com/#]viagra without prescription[/url]
buy viagra american express
viagra without a doctor prescription
viagra tablets uk
[url=http://smviagraytjdg.com/#]viagra no prescription[/url]
viagra 100mg sildenafil tablets
viagra pills
viagra without doctor
cheap viagra tablets uk
[url=http://viagrawyrfhdj.com/#]viagra without doctor[/url]
viagra sale vancouver bc
viagra without prescription
order viagra legally
[url=http://smviagraytjdg.com/#]viagra without a doctor prescription[/url]
buy viagra american express
will viagra work after ejaculation [url=http://viagratru.com]does generic viagra work[/url] is beetroot a natural viagra
buy generic viagra online do you need a prescription for viagra in south africa
http://viagratru.com - can you take viagra with plavix
how much is viagra to buy
buy viagra
the hard sell the life of a viagra salesman
[url=http://javiagraryjdf.com/#]viagra online[/url]
buying viagra in the uk over the counter
buy viagra online
online pharmacy viagra no prescription
[url=http://jfviagrayhf.com/#]viagra online[/url]
best viagra online pharmacy
does generic viagra look like
viagra online
price of viagra pills in india
[url=http://fmsviagrahddf.com/#]viagra[/url]
genuine viagra prices uk
generic viagra online
viagra in india online purchase
[url=http://gscviagratmn.com/#]generic viagra online[/url]
can you get viagra from tesco
order cialis professional online
generic cialis online pharmacy
cheap cialis india
[url=http://yicialisyoe.com/#]generic cialis tadalafil[/url]
cialis buy online generic
cialis online
generic cialis sale
[url=http://gvcialisdnw.com/#]cialis[/url]
where to buy cialis online no prescription
O http://viagrawithoutadoctormsn.com viagra legal online
pill ring for viagra [url=http://viagrawithoutadoctormsn.com/]http://viagrawithoutadoctormsn.com[/url] chimp viagra
search viagra viagra find edinburgh pages viagra without a doctor viagra equivalent herbal tablets
cs portable
adobe creative cloud download
adobe cc
[url=http://gmadobefjm.com/#]creative suite[/url]
flash professional cs6
adobe photoshop cc 2017
adobe photography plan
[url=http://yoadobehekku.com/#]photoshop cc 2017[/url]
cs 1.6
cialis pills sale
buy generic cialis online
cialis buy in canada
[url=http://yicialisyoe.com/#]cialis generic[/url]
cialis pills picture
cialis online pharmacy
cheap cialis au
[url=http://gvcialisdnw.com/#]cialis online pharmacy[/url]
how to buy generic cialis
adobe reader 11
adobe creative suite
photoshop creative cloud
[url=http://gmadobefjm.com/#]creative suite[/url]
그림íŒ
adobe photoshop cc
adobe creative cloud download windows
[url=http://yoadobehekku.com/#]adobe photoshop cs6[/url]
adobe professional
cheapest cialis generic
cialis generic
buy cialis 20mg online
[url=http://yicialisyoe.com/#]buy generic cialis online[/url]
where to order cialis online
online cialis
cheapest pharmacy cialis
[url=http://gvcialisdnw.com/#]cialis online[/url]
buy cialis professional online
brand levitra for sale
levitra bayer
buy real levitra
[url=http://yourlevitrabgk.com/#]levitra generic[/url]
levitra online order
viagra online with prescription uk
viagra for sale uk only
funcionan los genericos de viagra
[url=http://viagrafhnsau.com/#]viagra for sale uk only[/url]
cheap viagra jelly
viagra pills
where to buy viagra in abu dhabi
[url=http://dfvviagraujfdt.com/#]viagra tablet[/url]
wie sieht eine viagra pille aus
buy levitra from u.s. pharmacy
how to get levitra
buy levitra discount
[url=http://yourlevitrabgk.com/#]levitra free sample[/url]
buy levitra new zealand
is it ok to cut a viagra pill in half
viagra uk
viagra malaysia buy
[url=http://viagrafhnsau.com/#]viagra for sale uk only[/url]
low prices on viagra
viagra tablet
viagra price cvs pharmacy
[url=http://dfvviagraujfdt.com/#]viagra pills 100 mg[/url]
dosierung von viagra 100mg
buy cialis levitra
buy levitra online
safe place buy levitra
[url=http://yourlevitrabgk.com/#]levitra canada[/url]
cheap generic levitra online
can you buy viagra online legally
http://cialisrol.com buy cialis online
where to buy viagra in nagpur
[url=http://cialisrol.com]buy generic cialis[/url]
where to get prescription for viagra
buy cheap cialis
amlodipine with viagra
generic version viagra
viagra without a doctor's prescription
viagra de 10 mg
[url=http://fdkviagratrhge.com/#]viagra without doctor[/url]
viagra ice cream go sale selfridges
generic viagra
can you buy viagra over counter new zealand
[url=http://gkmviagragiuy.com/#]buy generic viagra online[/url]
viagra tablets buy online
online canadian pharmacy
legitimate canadian mail order pharmacies
no prior prescription required pharmacy
[url=http://canadianonlinegha.com/#]aarp recommended canadian pharmacies[/url]
Canadian Pharmacy
top rated online canadian pharmacies
canadian online pharmacy
[url=http://cvcanadianpharmaciesghn.com/#]approved canadian online pharmacies[/url]
CVS Pharmacy
no prior prescription required pharmacy
canadian pharmacies shipping to usa
reputable canadian online pharmacies
[url=http://canadianonlinegha.com/#]canada pharmacies online prescriptions[/url]
canadian pharmacy cialis
canada pharmacies online prescriptions
prescription drugs online without doctor
[url=http://cvcanadianpharmaciesghn.com/#]aarp recommended canadian pharmacies[/url]
Best Online International Pharmacies
buy viagra cheap online
generic viagra
buy viagra melbourne australia
[url=http://viagragenericvghse.com/#]generic viagra without script[/url]
viagra sale in sydney
viagra online without script
cheap viagra eu
[url=http://viagradoctorskllr.com/#]viagra without a doctor prescription[/url]
cuanto sale viagra en argentina
viagra buy now
generic viagra
buy cialis and viagra
[url=http://viagragenericvghse.com/#]generic viagra 100mg[/url]
take 50mg viagra
viagra without a doctor prescription
order viagra no prescription
[url=http://viagradoctorskllr.com/#]viagra online without script[/url]
quanto costa viagra generico farmacia
viagra apotheke niederlande
http://cialisroq.com/ cheap cialis
can you take viagra and cymbalta
[url=http://cialisroq.com/]http://cialisroq.com[/url]
indian viagra in india
cheap cialis
viagra and diabetes 2
what is the most powerful viagra
http://viagrans.com/ generic viagra online
what medicine can you not take with viagra
[url=http://www.viagrans.com/]viagrans.com[/url]
how to use himalayan viagra
does 50mg of viagra work
will viagra make you hard
[url=http://www.viagrabs.com/]viagra online[/url]
will viagra work for everyone
http://viagrabs.com/
do you need a prescription for viagra ireland
how young can you use viagra
[url=http://viagrabs.com/]http://viagrabs.com/[/url]
bahan herbal viagra
generic viagra
heart medicine and viagra
what to expect first time using cialis
tadalafil online
side effects of expired cialis
[url=http://cialisoni.com/]buy cialis online[/url]
can i take norvasc and cialis
100mg 50mg viagra
ed pills
obat kuat cialis 20mg
[url=http://edpillsfgbnd.com/#]erectile dysfunction remedies[/url]
movie with viagra salesman
best ed pills
buy viagra online tesco
[url=http://bestpillsforedfegge.com/#]ed pills that work[/url]
viagra sales in london
sildenafil 50mg tablets uk
erectile dysfunction remedies
generic viagra rx
[url=http://edpillsfgbnd.com/#]erection pills[/url]
purchase real viagra online
best ed pills
donde comprar cialis generico df
[url=http://bestpillsforedfegge.com/#]ed pills that work[/url]
cheap genuine cialis
levitra vs cialis price
ed pills that work
cialis 10 mg filmtabletten preis
[url=http://edpillsfgbnd.com/#]ed pills[/url]
50 mg of viagra
erectile dysfunction remedies
se puede comprar viagra andorra sin receta
[url=http://bestpillsforedfegge.com/#]sex pills[/url]
next day generic viagra delivery
cheap levitra 40 mg
erectile dysfunction remedies
how to get a free viagra
[url=http://edpillsfgbnd.com/#]best ed pills[/url]
buying cialis on the internet
sex pills
get viagra over internet
[url=http://bestpillsforedfegge.com/#]sex pills[/url]
buy cialis online no prescription canada
combining cialis and levitra
cialis canada
purchasing cialis online canada
[url=http://cialisoni.com/]cialis coupon[/url]
can i take cialis the night before surgery
cialis for sale canada
cialis
cialis cheap usa
[url=http://buycialishjmfgj.com/#]cialis[/url]
buy cialis online malaysia
cialis canada
cialis professional cheap
[url=http://cialistabletfgbmas.com/#]cialis tablets[/url]
buy cialis in india
buy cialis online london
buy generic cialis
cialis discount program
[url=http://cialisfbvghf.com/#]generic cialis[/url]
cialis c20 pill
buy cialis
cialis for sale in toronto
[url=http://buycialishjmfgj.com/#]cheap cialis[/url]
cheapest cialis online
womens viagra pink pill
buy generic viagra
buy viagra in nyc
[url=http://viagragenericgnmdsefg.com/#]buy generic viagra online[/url]
generic viagra american express
viagra tablet
viagra sale in hyderabad
[url=http://viagrapillskjnmb.com/#]viagra pills[/url]
can u take viagra and cialis together
Add Your Comments
|